
Figure 6 .
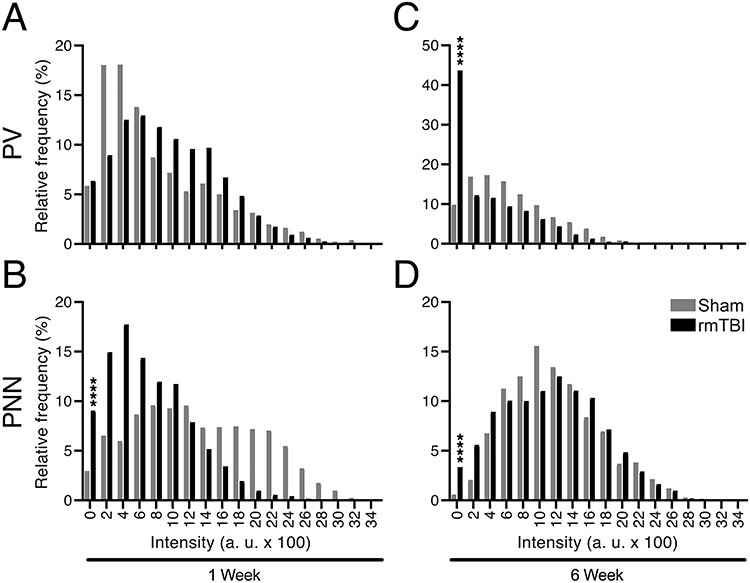
PV-positive and PNN-positive counts in the barrel cortex. Cells identified as PV+ and/or PNN+ were masked and PV and PNN fluorescent levels were measured separately for each masked area. Relative frequency of cells at given PV and PNN intensity levels were plotted. (A) One week after rmTBI relative percentage PV intensity values showed no significant difference between rmTBI and sham animals in the percentage of cells between 0 and 200 a.u. of all cells measured. However, a trend is observed toward a shift in intensity of PV cells in rmTBI group in bins 800–1800. (B) PNN intensity values at this time point decreased in rmTBI group, as 203 cells compared with 58 cells fell in the 0–200 a.u. category. (C) When PV+ cells were investigated 6 weeks after rmTBI, 952 cells fell between 0 and 200 a.u. in rmTBI animals compared with 75 cells in sham group. (D) PNN intensity values at this time point decreased as well in rmTBI group, as 95 cells compared with 14 cells fell in the 0–200 a.u. category (****P ≤ 0.0001).