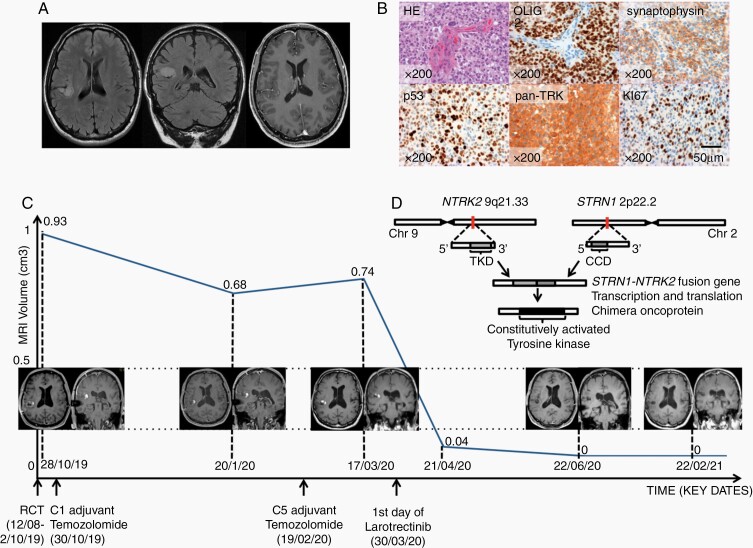
Fig. 1.
(A) Brain MRI in 2012. From left to right: axial and coronal FLAIR, axial T1 gadolinium-enhanced section showing a right non-enhancing insular intra-axial lesion. (B) from left to right: (1) epithelioid and ganglion-like tumor cells and microvascular proliferation; (2) strong expression of the glial marker; (3) heterogeneous expression of the neuronal marker; (4) p53 strong and heterogenous staining; (5) pan-TRK strong expression in tumor cells; (6) high proliferation index of 20%. Images 2-6 were obtained using IHC (HE: hematoxylin-eosin, IHC: immunohistochemistry). (C) T1 gadolinium-enhanced MRI measured tumor volume as a function of time and corresponding MRI scans (RCT: radiochemotherapy). (D) schematic representation of NTRK2-STRN1 fusion (TKD: tyrosine kinase domain, CCD: coiled-coil domain).

