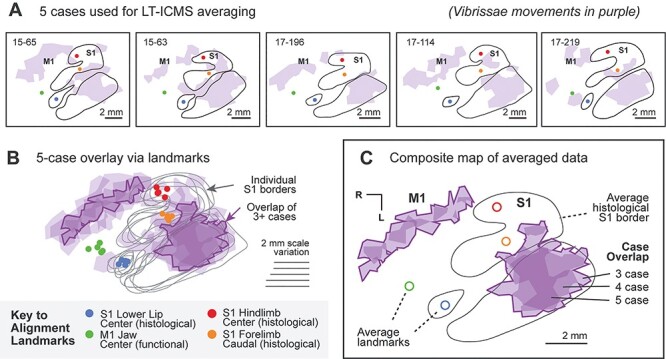
Figure 3 .

Methods for combining data across multiple cases to produce a composite map of movement types. (A) Five different cases with dense movement maps in M1 and S1 are included in our composite maps. Histologically defined borders of S1 are indicated by black lines, along with regions of neocortex from which movements of the vibrissae were evoked using LT-ICMS, shown in purple. Four landmarks on the cortex are indicated in each case: the center of the lower lip microvibrissae barrels of S1 (blue circle), the caudal edge of the forelimb region of S1 (orange circle), the center of the hindlimb region of S1 (red circle), and the functional center of the region of jaw opening in M1 (green circle). (B) All five cases are overlaid on top of one another and aligned (see Methods). Cases are rotated and scaled to minimize the distance between the histological borders of S1, as well as the four landmarks described above. Portions of M1 and S1 from which movements of the vibrissae were evoked are shown in purple. Gray lines indicate the borders of S1 for each of the five cases. The dark purple outlines surround regions where vibrissae representations were located in 3 or more cases. (C) A final composite map generated from 5 cases. The border of S1 (black line) is an averaged vector of the individual S1 borders shown in gray in B. The open shape landmarks indicate the average position of the landmarks for each of the five cases. Finally, the region in which 3 or more cases’ vibrissae representation overlapped is shown in purple, with areas of minimal overlap having been removed from the previous step illustrated in B.
