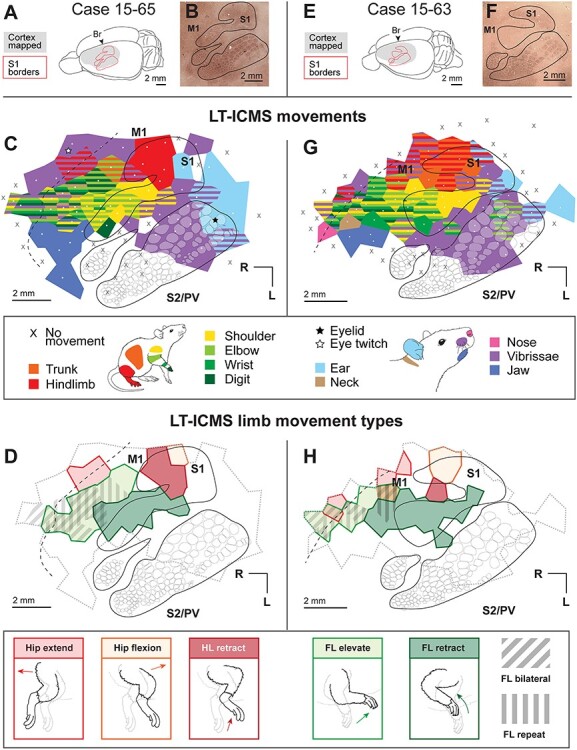
Figure 4 .

Movement maps produced from LT-ICMS in cases 15-65 and 15-63. (A) Dorsolateral view of the brain of case 15-65 indicating locations of S1 borders and the region that we explored using ICMS (gray). (B) A flattened section of cortex stained for CO, with S1 outlined. (C) Movement maps in S1 and M1 produced from LT-ICMS up to 300 μA. White dots indicate electrode penetration sites, with colored polygons indicating the body movements elicited from stimulation at that site. Black lines indicate the histologically determined border of S1. Opaque white round shapes indicate barrels identified from CO or myelin stains. The black dotted line indicates the approximate rostral border of M1 determined from myelin staining. (D) Forelimb and hindlimb movement types elicited from the same case. Evoked hindlimb movements include hip extension, hip flexion, and hindlimb retraction. Evoked forelimb movements include elevation in M1 and retraction in S1 and M1. Diagonal hatches indicate regions in M1 where bilateral forelimb movements were evoked, while vertical hatches indicate regions in M1 where repetitive forelimb movements were evoked. The grey dotted line indicates the area from which movements were evoked in (C). (E–H) Results from case 15-63, organized as in (A–D).
