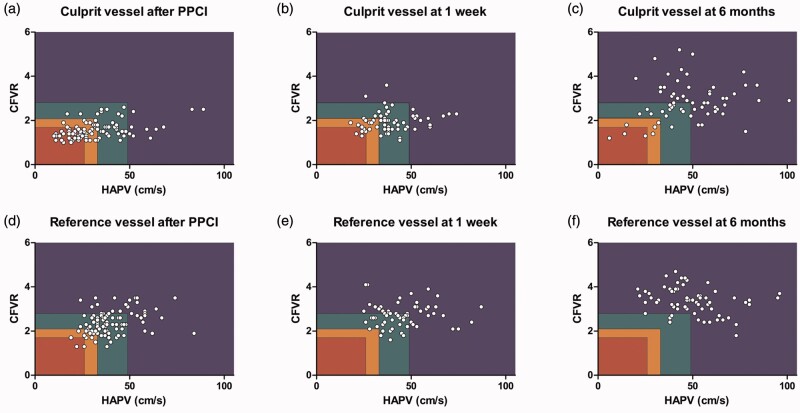
Figure 2.
Scatterplot of the time course of coronary flow capacity (CFC) in the culprit vessel ((a), (b) and (c)) and non-culprit vessel ((d), (e) and (f)) after primary percutaneous coronary intervention, at one-week follow-up and six-month follow-up. The rectangles represent CFC categories; blue: normal CFC; green: mildly reduced CFC; orange: moderately reduced CFC; red: severely reduced CFC. CFVR: coronary flow velocity reserve; hAPV: hyperaemic average peak flow velocity; PPCI: primary percutaneous coronary intervention.

