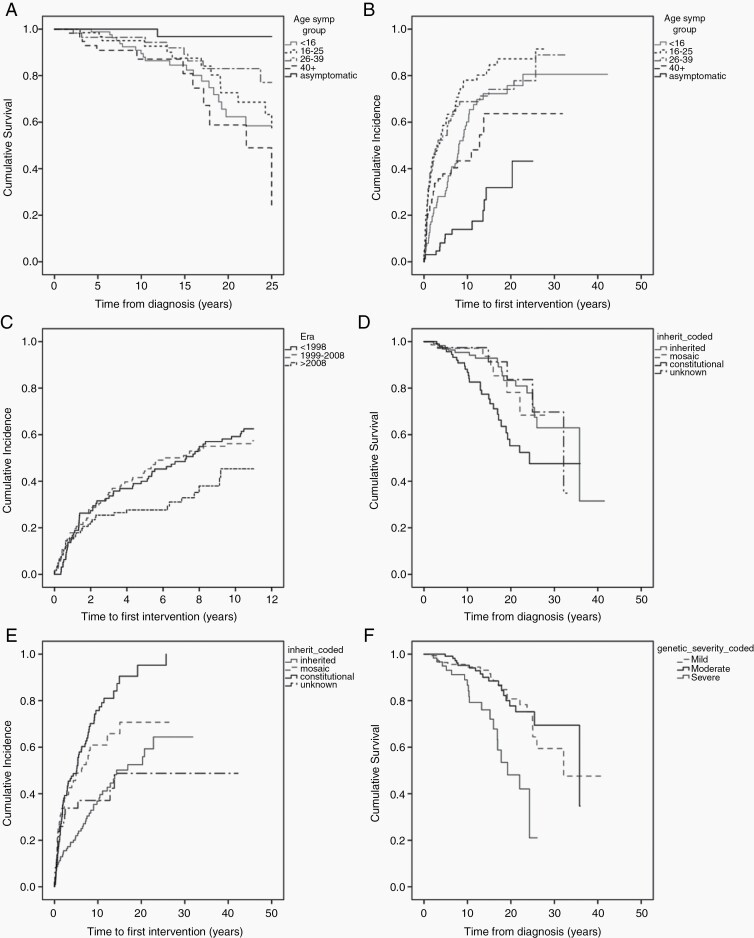
Fig. 1.
Kaplan-Meier curves demonstrating: a, overall survival by age of onset (censored at 25 years). b, time to first VS intervention (VS operation/radiotherapy) by age of onset. c, time to first VS intervention (VS operation/radiotherapy) by era (censored at 11 years). d, overall survival by inheritance type. e, time to first VS intervention (VS operation/radiotherapy) by inheritance type. f, overall survival by severity classification.

