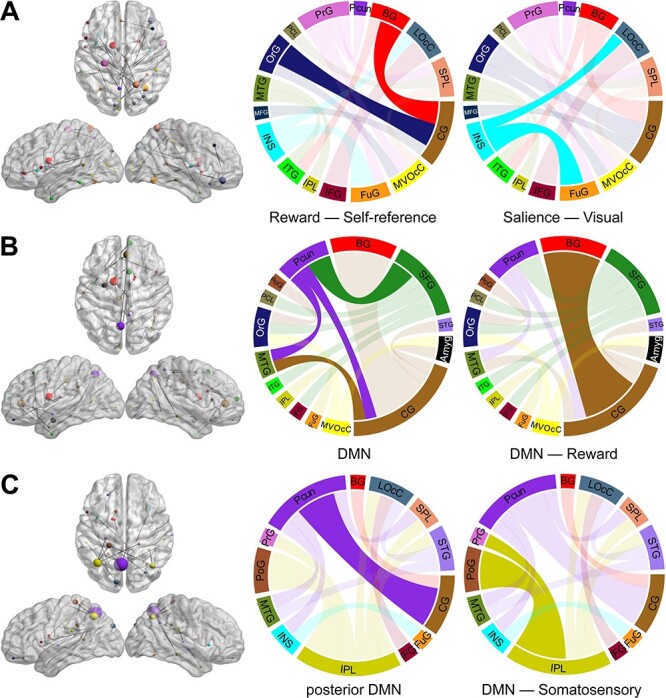
Figure 4 .

The connectivity patterns revealed by PCA. (A) PC1 connectivity pattern, (B) PC2 connectivity pattern, and (C) PC3 connectivity pattern. The size of each node in the left is directly related to its number of connections. Nodes from the same macroscale brain region are depicted in the same color. In the circular connectograms, the size of edges reflects the number of connections.
