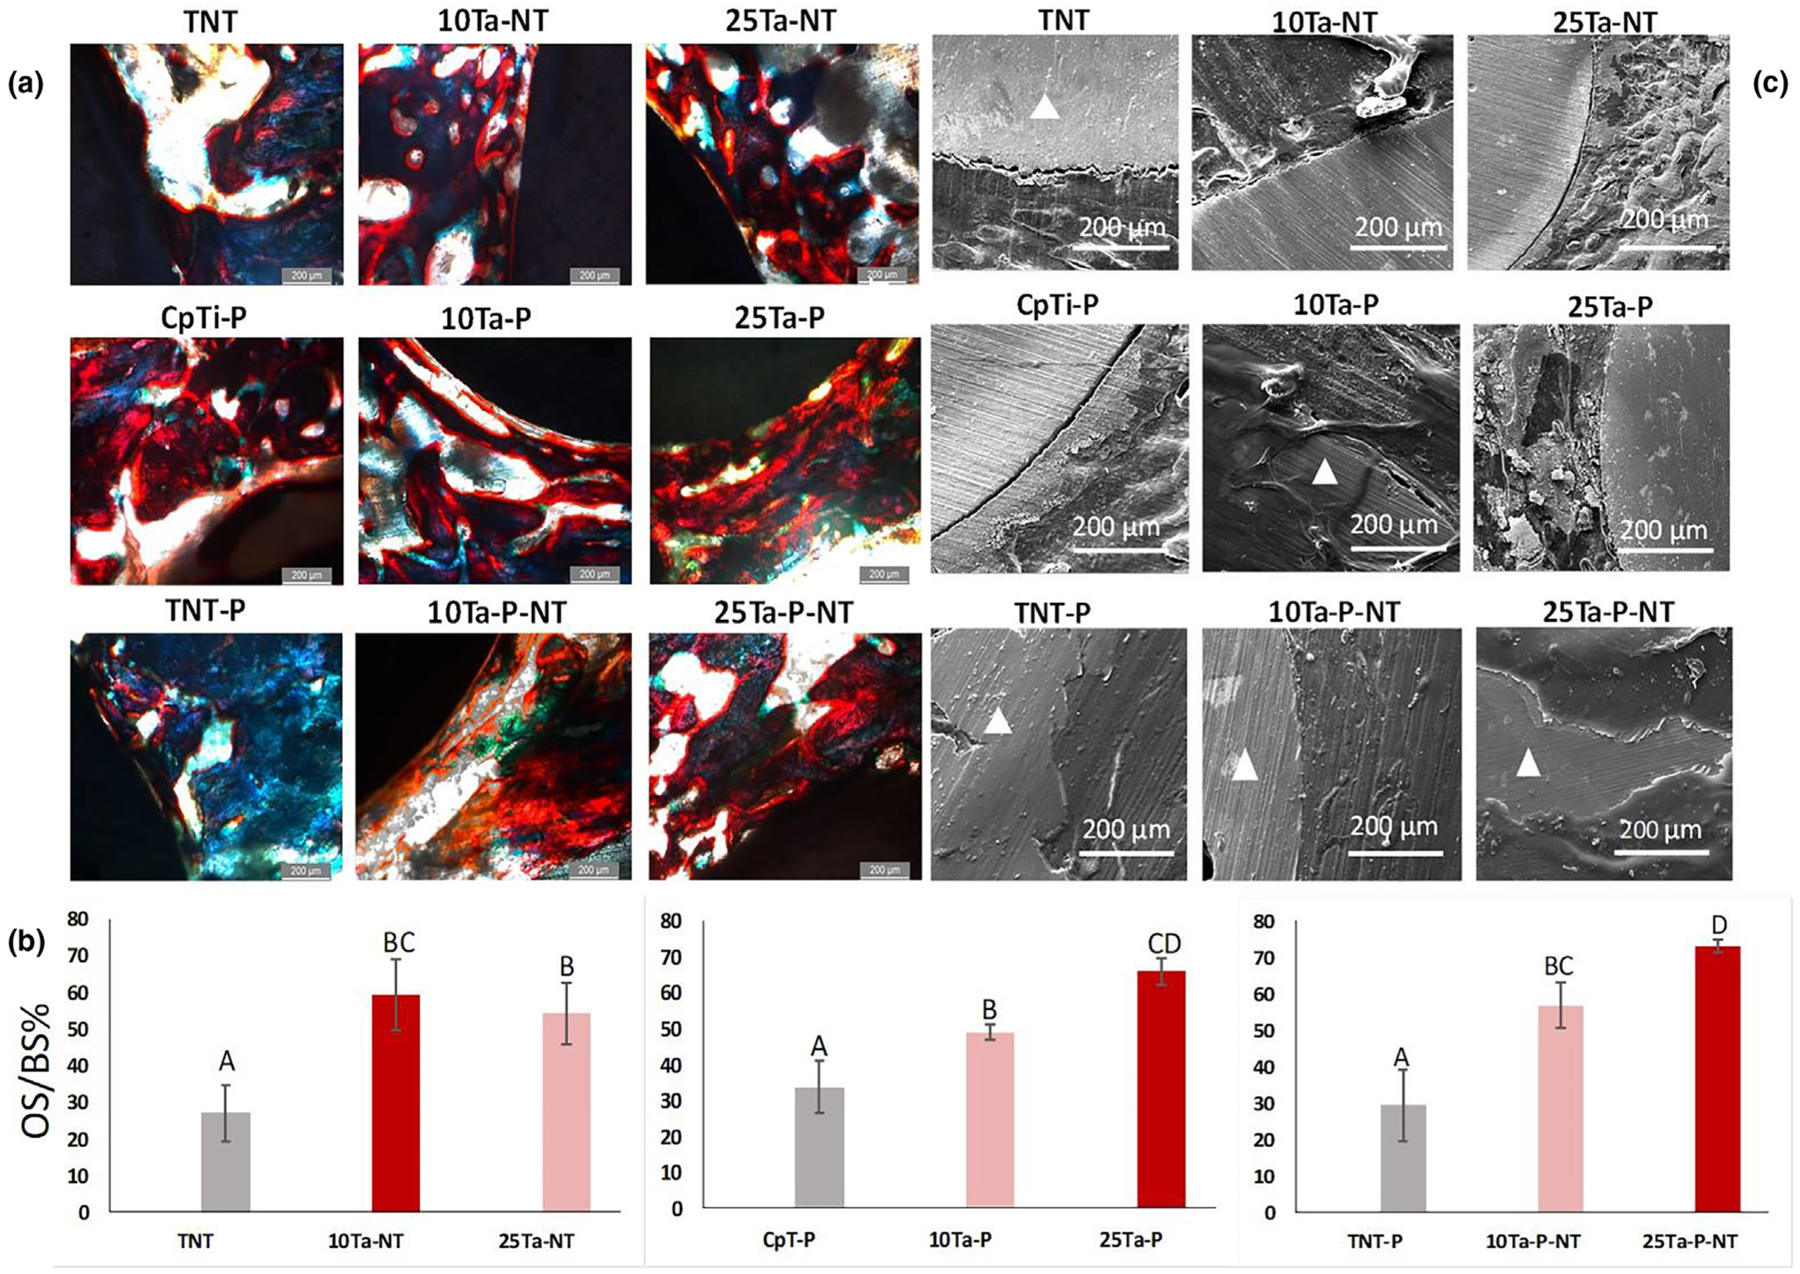
FIGURE 6.

a. Histological evaluation on the 300 μm thin sections of the Spurr embedded explant femurs reveals early-stage osteoid formation in both the 10Ta-NT and 25Ta-NT at 5-weeks. Osteoid presence was marked via red color from Modified Masson Goldner’s stain. Nonuniform osteoid formation along the bone-implant interface was observed for the TNT (control). In comparison to TNT, 10Ta-NT and 25Ta-NT show a higher presence of osteoid, measuring 59 ± 10% and 54 ± 8%, respectively. Scale bars measure 200 μm. b. graphs represent quantitative histomorphometric representation of the OS/BS% in histology micrographs. All compositions show higher osteoid formation compared to control (CpTi-P, TNT, TNT-P). A sample size of n = 6 was considered for each composition, and statistical analysis was done on the histomorphometric data using one-way ANOVA with Tukey–Kramer correction for the pairwise comparison for means. Mean observations with standard deviation have been reported in the bar charts. Means that do not share a letter are significantly different, c. SEM micrographs of the bone-implant interface reveal the presence of noticeable gaps in TNT, indicating limited osseointegration. The 25Ta-NT displays decreased gap width compared to TNT. However, 10Ta-NT shows very well integrated osseous tissue at the bone-implant interface at 5 weeks post-implantation. Triangle shapes mark the implant area in the micrographs.
