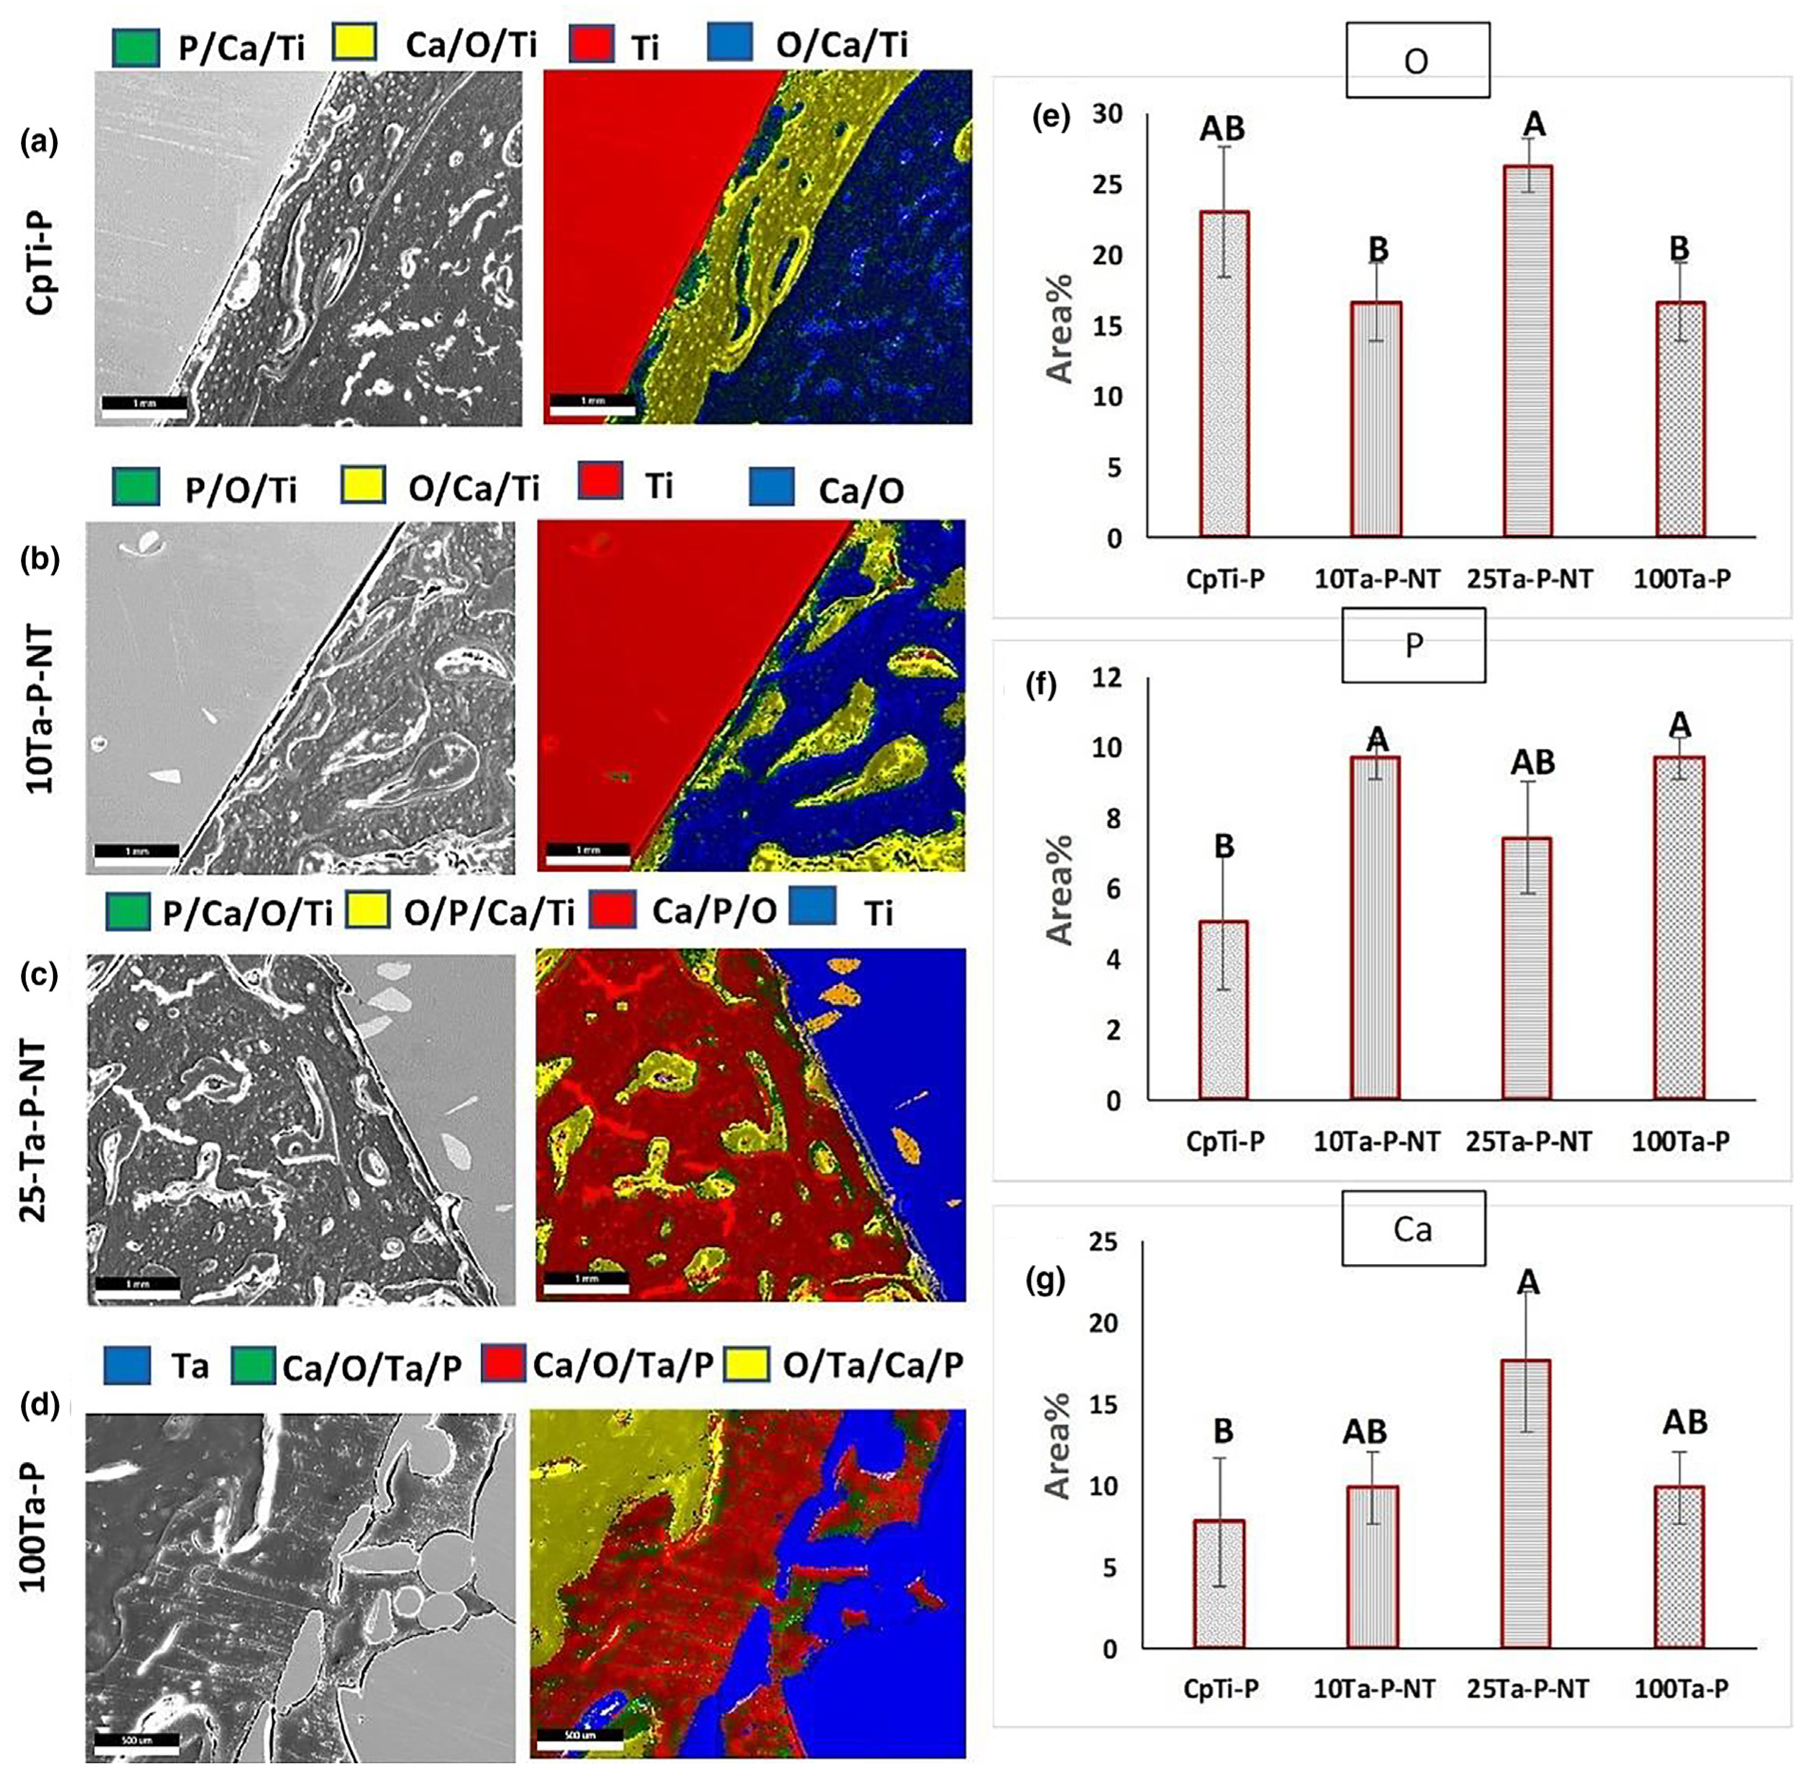
FIGURE 9.

(a–d) EDS live mapping for elemental detection showing different zonal diffusion of detectable elements. The left column represents SEM micrographs of the examined area, and the right column represents EDS live maps. (e–g) exhibits quantification of major elements detected during the live mapping around the implants (O, P, and Ca). The same sample size of n = 3 was considered for each composition, and statistical analysis was done on the EDS data using one-way ANOVA with Tukey–Kramer correction for the pairwise comparison for means. Means that do not share a letter are statistically significantly different. Scale bars measure 1mm or 1000 microns.
