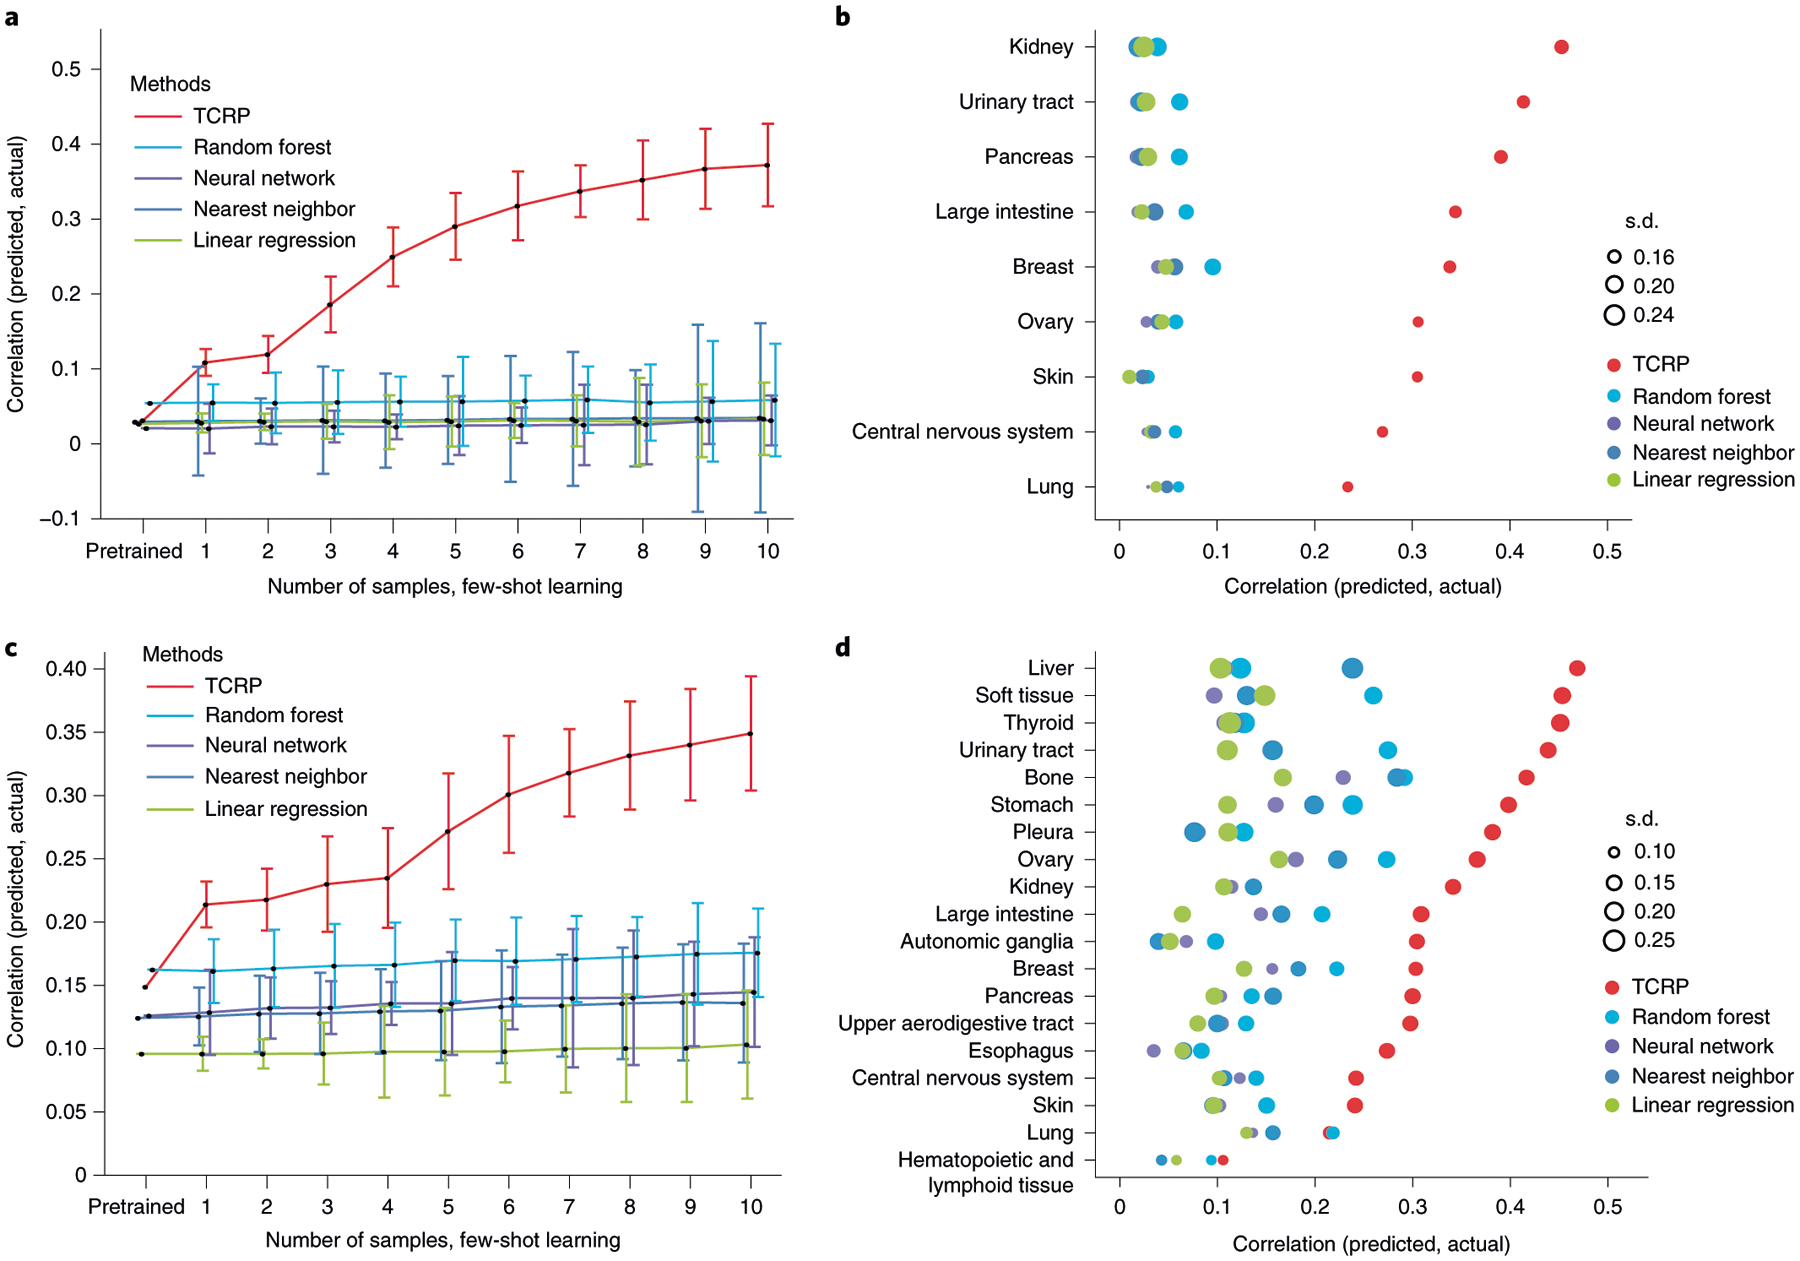
Fig. 2 |. Transfer of predictive models across tissue types.

a, Challenge 1a. For each CRISPR gene knockout and target tissue, model accuracy is measured by Pearson’s correlation between predicted and actual drug responses, considering only the test samples from the target. The plot shows the average model accuracy across CRISPR knockouts (y axis, mean ± 95% confidence interval (CI)) as a function of the number of cell lines (from n = 0 cell lines to n = 10 cell lines) from the target tissue provided to the model during training (x axis), considering in total n = 335 cell lines with n = 469 gene disruptions. b, Model accuracy (x axis) is displayed separately for each tissue in challenge 1a (y axis). Accuracy is the average achieved when training includes five to ten samples of the target tissue. The accuracy s.d. is shown over all CRISPR gene knockouts (point size). c, As for a for models trained on perturbations with n = 199 targeted drugs and n = 1,001 cell lines. d, As for b for models trained on perturbations with targeted drugs.
