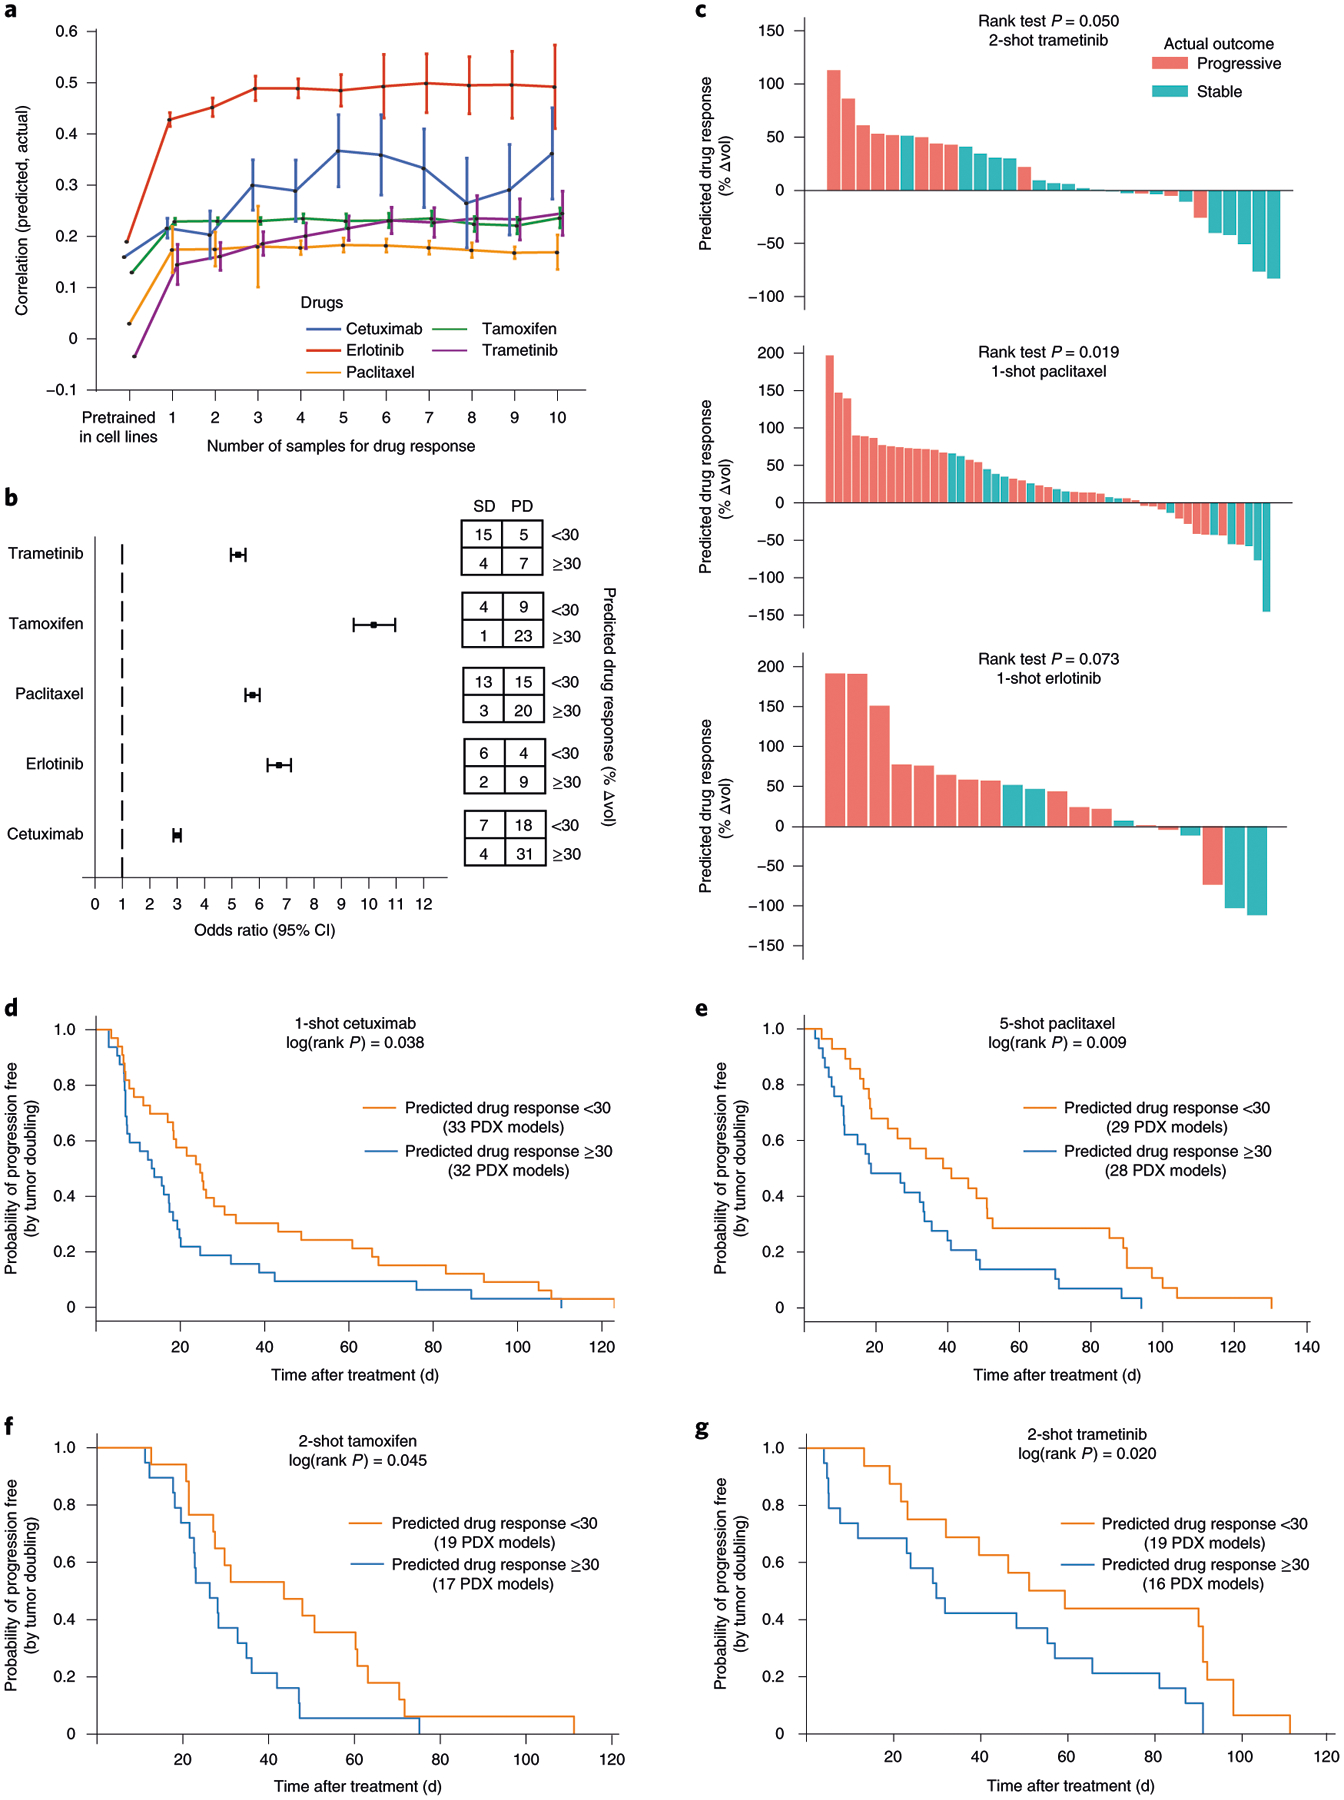
Fig. 4 |. Transfer of cell-line models to PDXs.

a, Challenge 3. Predictive models were pretrained using responses of cancer cell lines to targeted perturbations with drugs, one model per drug. Few-shot learning (x axis, number of few-shot samples used) was performed using PDX samples exposed to one of five drugs (line colors), and the improved model used to predict the change in tumor volume (Δvol; Methods). Accuracy of this prediction was validated using the actual changes in volume of the remaining held-out PDXs (Pearson’s correlation, y axis, mean ± 95% CI). This experiment included in total n = 228 PDX models. b, Odds ratio. We evaluated the odds of obtaining SD:PD outcomes when stratifying tumors into predicted responsive versus unresponsive subtypes (predicted Δvol < or ≥30%, respectively). Odds ratio (left) and corresponding contingency table (right), are shown for each drug (n = 31 samples for trametinib, n = 37 for tamoxifen, n = 51 for paclitaxel, n = 21 for erlotinib and n = 60 for cetuximab). Error bar represents mean ± 95% CI. c, Ranking of all PDX samples (x axis) by the predicted Δvol (y axis) for trametinib, paclitaxel and erlotinib. Color indicates actual clinical outcome. The rank P value is calculated by using a one-sided Wilcoxon’s Mann–Whitney U-test (n = 31 samples for trametinib, n = 51 for paclitaxel and n = 20 for erlotinib). d–g, Kaplan–Meier survival plots when stratifying tumors into responsive versus unresponsive subtypes for cetuximab (d) on n = 65 PDX models, paclitaxel (e) on n = 57 PDX samples, tamoxifen (f) on n = 36 PDX samples and trametinib (g) on n = 35 PDX samples. The log(rank P value) is calculated using a two-sided χ2 test.
