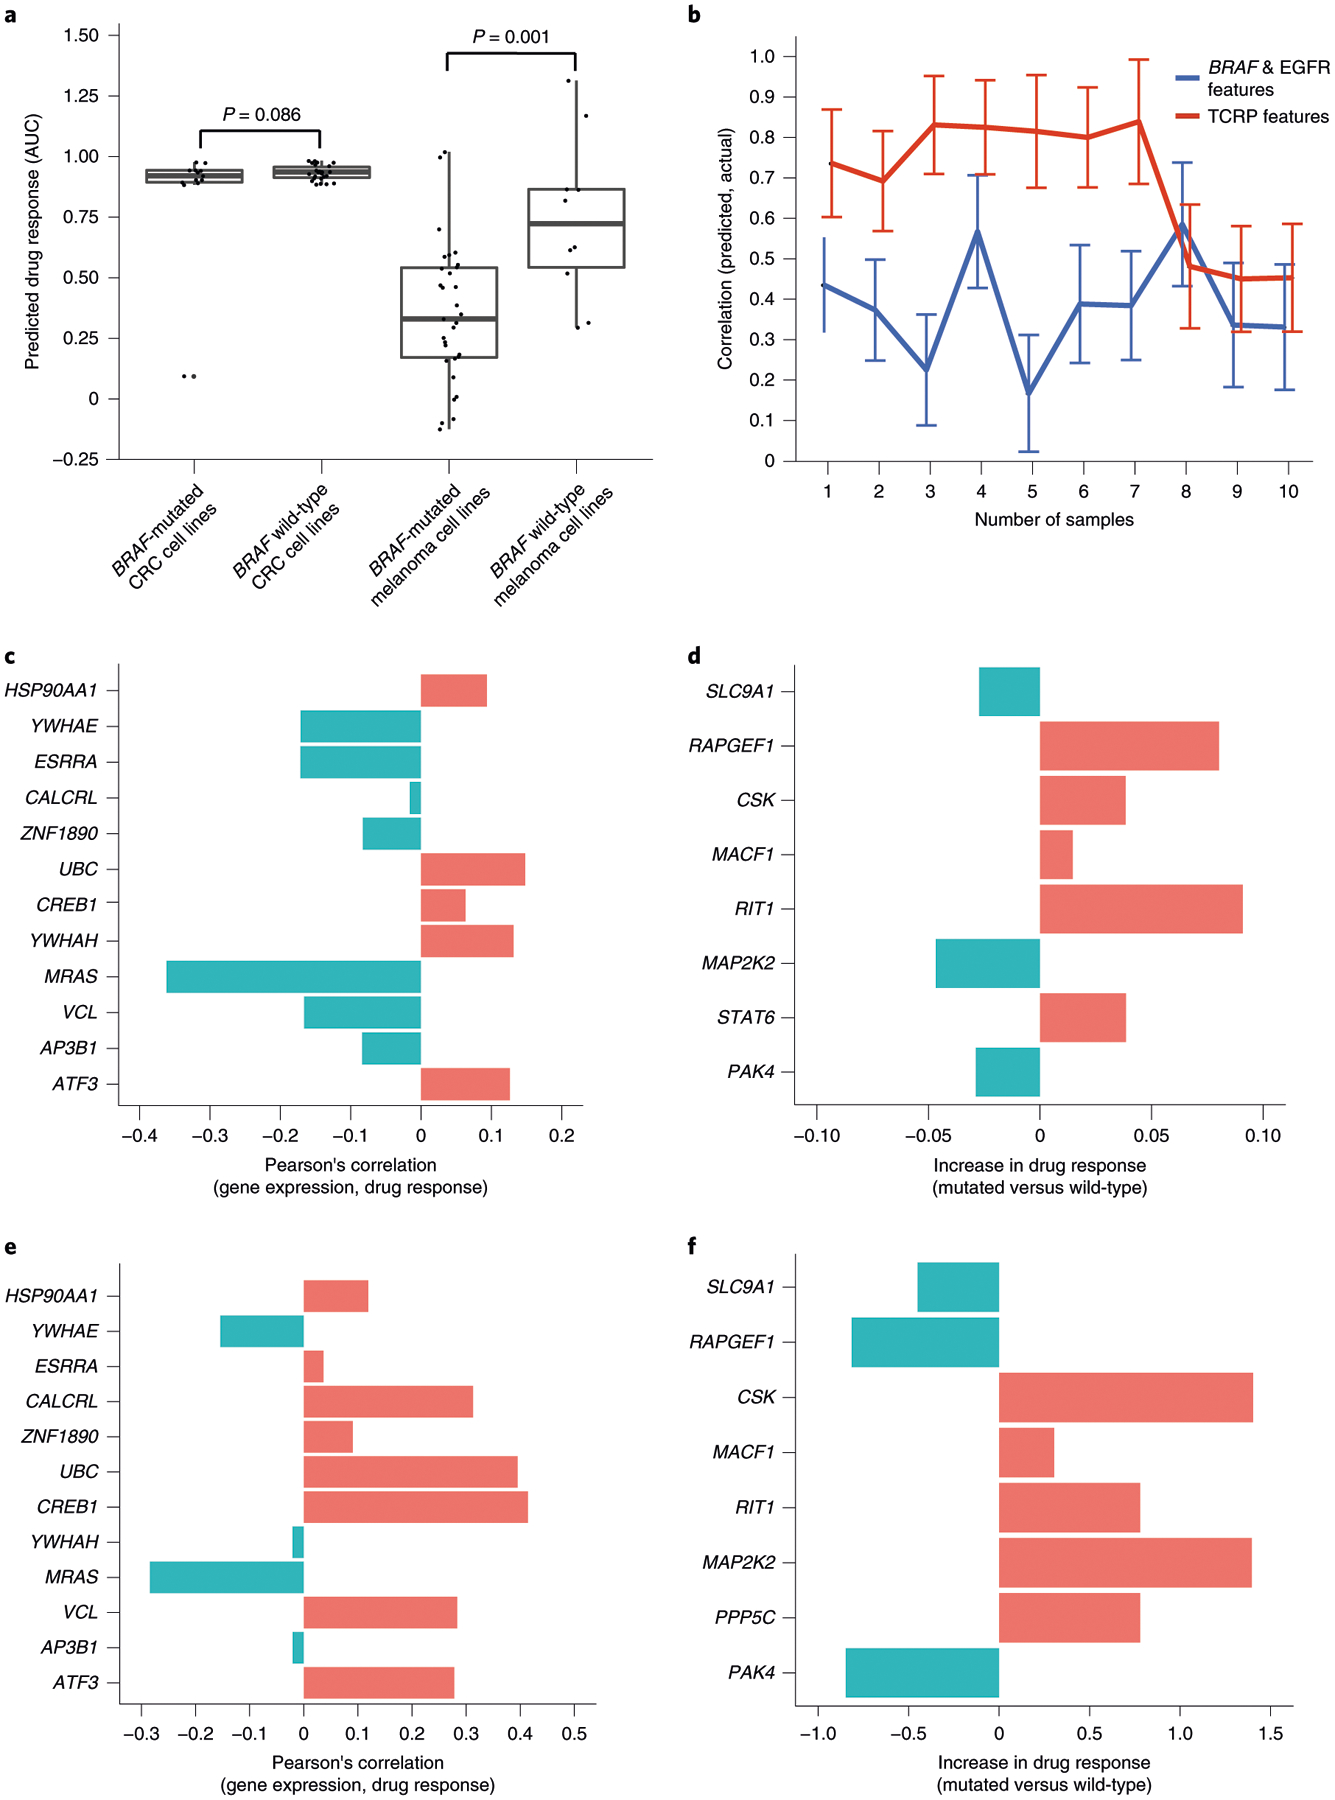
Fig. 6 |. Model predictions and interpretation for the BRAF inhibitor dabrafenib.

a, Box plots of predicted dabrafenib response for n = 39 CRC and n = 42 melanoma cell lines with respect to BRAF mutation status. The rank P value is calculated by using a one-sided Wilcoxon’s Mann–Whitney U-test on a total of n = 81 cell lines. The error bar represents mean ± 95% CI. b, Prediction accuracy of the TCRP model for CRC and melanoma cell lines used for a. Accuracy (y axis) is shown as a function of additional training samples used for few-shot learning (x axis). Accuracy mean and s.d. calculated over ten random samples of cell lines selected from n = 39 CRC and n = 42 melanoma cell lines used for training. c, Pearson’s correlation of dabrafenib response (AUC) and mRNA expression for the top expression-based features for CRC (ranked in decreasing importance from top to bottom; Methods). d, Relative change in dabrafenib response (AUC) on somatic mutation of each of the top mutation-based features for CRC (ranked in decreasing importance from top to bottom; Methods). e, Similar to c for melanoma. f, Similar to d for melanoma.
