Figure 2 .

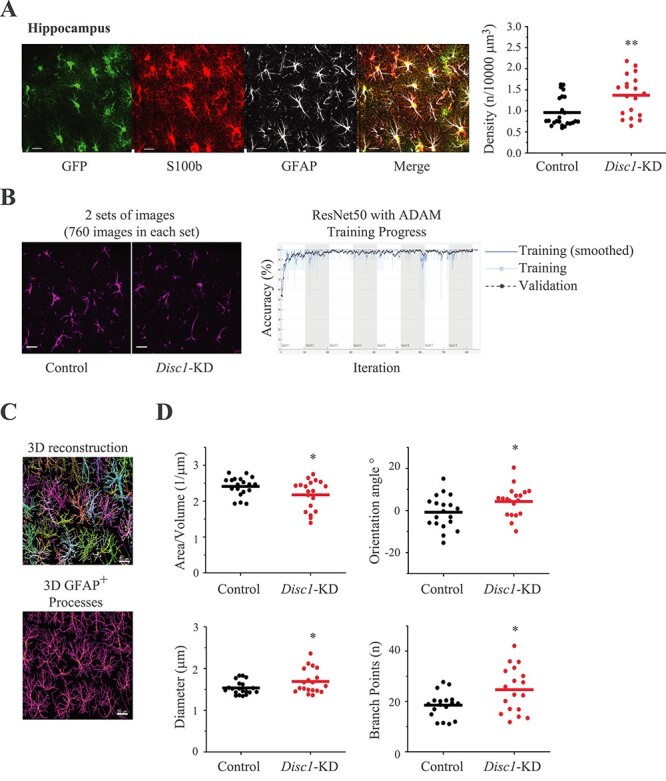
Disc1-KD affects astrocyte morphology. (A) Spatial density of astrocytes; the left panel—representative images of GFP+ (green) astrocytes co-stained with anti-S100b (red) and anti-GFAP (gray); scale bar—20 μm; the right panel—quantitative analysis of spatial density; Student two-tail t-test, t = −3.168, **- P = 0.0034, N = 19–24 images/2 sections per mouse/4 mice per group; (B) Transfer learning approach using cDNNs; the left panel—representative images of control and Disc1-KD GFAP+ astrocytes used for classification with pre-trained cDNNs ResNet50 and transfer learning, GFP channel is not shown, scale bar—20 μm; the right panel—representative histogram of training progress of the ResNet50 with ADAM optimizer; the X axis represents the number of epochs (total 8) with 103 iterations in each epoch. (C) 3D reconstruction of GFAP+ astrocytes with single astrocytes being colored with different colors and 3D visualization of GFAP+ main processes of astrocytes, scale bar—20 μm; (D) Quantitative analysis of area/volume ratio (Student two-tail t-test, t = 2.070, *- P = 0.046), processes orientation angle (Student two-tail t-test, t = −2.102, *- P = 0.042), diameter of GFAP+ processes (Student two-tail t-test, t = −2.278, *- P = 0.028) and number of branch points (Student two-tail t-test, t = −2.528, *- P = 0.018); N = 19 images/2 section per mouse/4 mouse per group.
