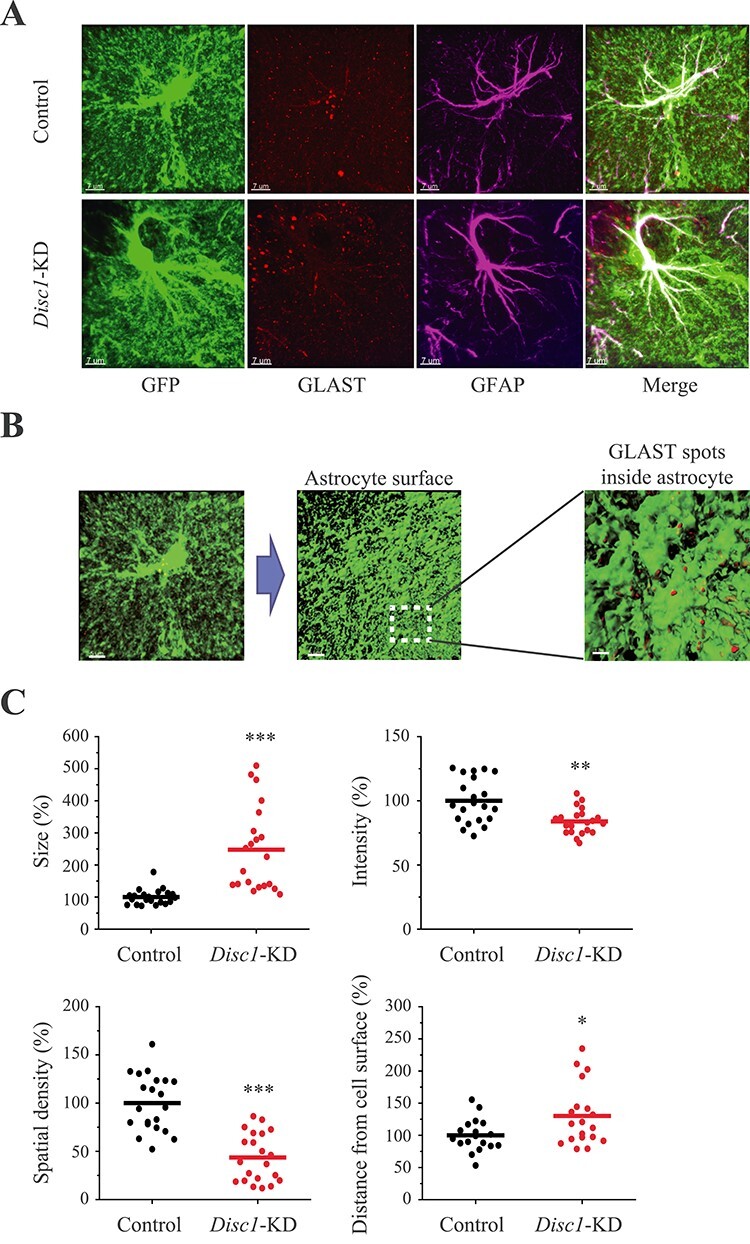
Figure 3 .

Disc1-KD alters expression and distribution of GLAST in astrocytes. (A) Representative images of control and Disc1-KD GFP+ (green) astrocytes co-stained with anti-GLAST (red) and anti-GFAP (magenta); scale bar—7 μm; (B) Assessing GLAST+ spots within individual GFP+ astrocytes; representative image of a GFP+ astrocyte, scale bar—5 μm; 3D surface visualization, scale bar—5 μm; a blown-up area outlined with GLAST+ spots within (brown) and on the surface of the GFP+ astrocyte (red); scale bar—1 μm; (C) Quantitative analyses of GLAST+ spots within individual astrocytes: size (Student two-tail t-test, t = −4.957, ***- P = 6.6*10−5), intensity (Student two-tail t-test, t = 3.4965, **- P = 0.0015), spatial density (Student two-tail t-test, t = 6.4748, ***- P = 1.3*10−7) and distance from astrocyte surface (Student two-tail t-test, t = −2.436, *- P = 0.021); N = 19–20 images/2 sections per mouse/4 mice per group.
