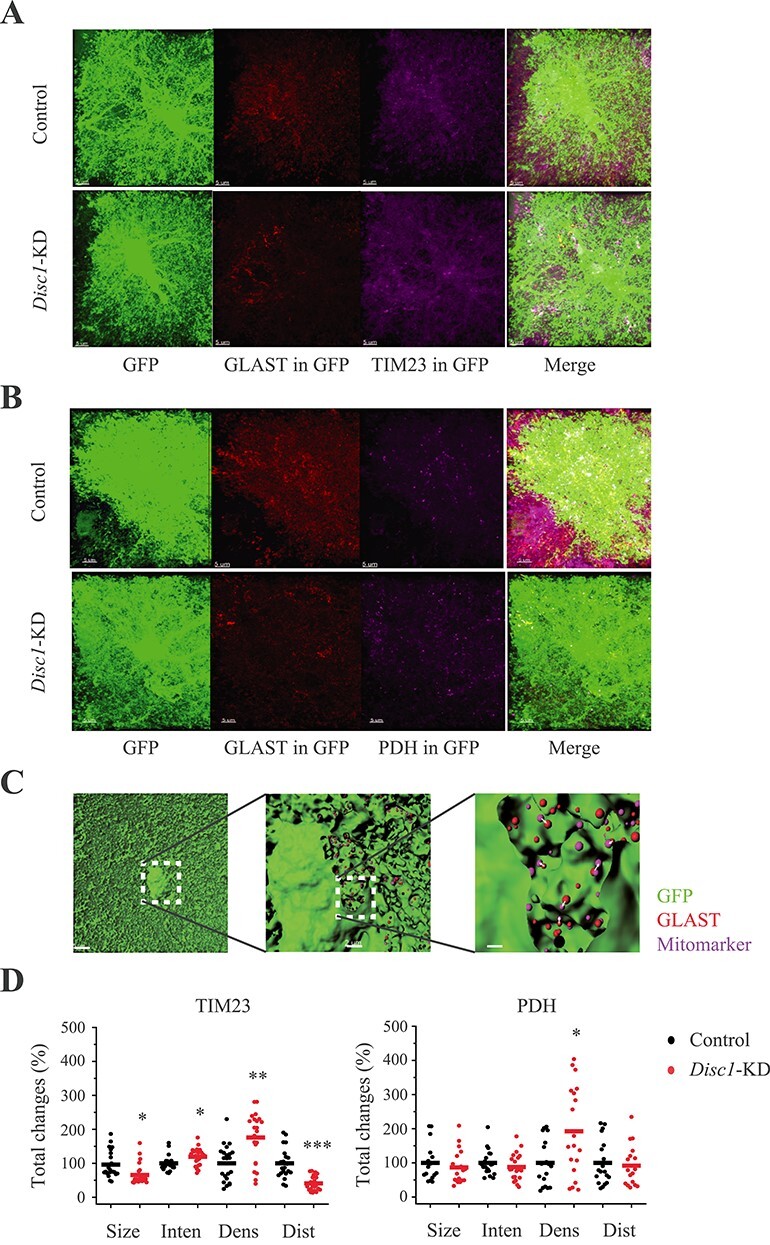
Figure 4 .

Disc1-KD affects expression of the mitochondrial markers in astrocytes. (A) Representative images of GFP+ control and Disc1-KD GFP+ (green) astrocytes stained with anti-GLAST (red) and anti-TIM23 (magenta); GLAST+ (GLAST in GFP) and TIM23+ (TIM23 in GFP) immunoreactivity inside GFP+ astrocyte are shown, scale bar—5 μm. (B) Representative images of GFP+ control and Disc1-KD astrocytes stained with anti-GLAST (red) and anti- anti-PDH (magenta); GLAST+ (GLAST in GFP) and PDH + (PDH in GFP) immunoreactivity inside GFP+ astrocyte are shown, scale bar—5 μm. (C) A workflow for analysis of mitomarkers and GLAST+ spots: 3D surface of the GFP+ mask (green) for astrocytes (the left panel), scale bar—5 μm; GLAST+ (red) and a mitochondrial marker (magenta) spot within an astrocyte (a clipping plane, the middle panel), scale bar—2 μm; a blown-up clipping plane with GLAST+ (red) and mitomarker (magenta) spots inside an astrocyte (the right panel); arrows—distance between GLAST and mitomarker; scale bar—1 μm. (D) Quantitative analyses of PDH+ and TIM23+ spots within individual astrocytes. For TIM23: Size (Student two-tail t-test, t = 3.2426, *- P = 0.0023), Inten—intensity (Student two-tail t-test, t = −2.659, *- P = 0.0111), Dens—spatial density (Student two-tail t-test, t = −4.0026, **- P = 0.00029), and Dist—distance (Student two-tail t-test, t = 5.406; ***- P = 8.2*10−6), between GLAST+ puncta and the mitochondrial marker inside individual astrocytes. For PDH: Dens—spatial density, Student two-tail t-test, t = −2.107, *- P = 0.045. N = 19–24 images/2–3 sections per mouse/4 mice per group.
