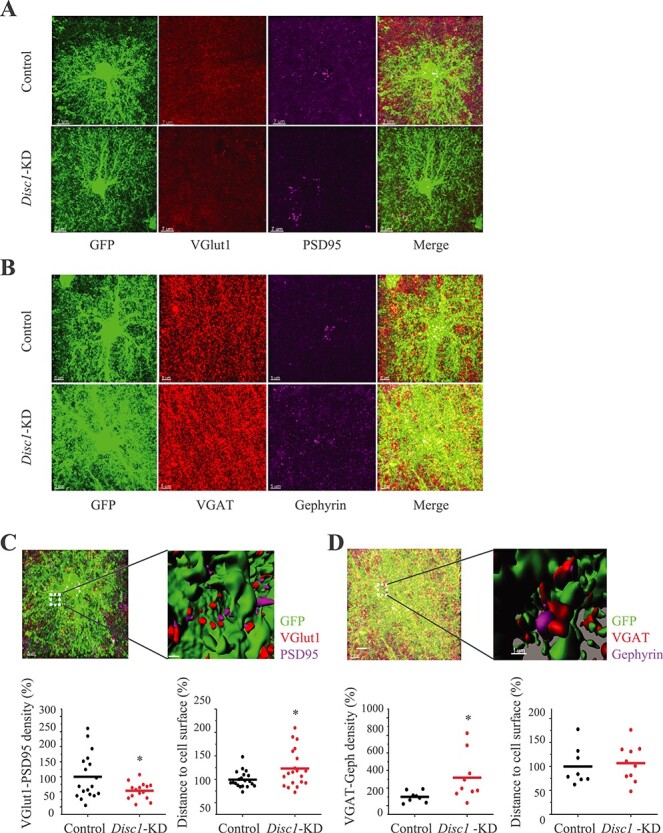
Figure 5 .

Disc1-KD alters expression of the synaptic markers within the astrocyte zone. (A) Representative images of GFP+ astrocytes co-stained with anti-VGLUT1 (red), anti-PSD95 (magenta), scale bar—7 μm; (B) Representative images of GFP+ astrocytes co-stained with anti-VGAT (red), anti-Gephyrin (magenta), scale bar—5 μm; (C) The upper panels: 3D visualization of glutamatergic puncta near the astrocyte surface within the individual territory of astrocyte; VGLUT1 (red) and PSD95 (magenta) puncta, scale bar—5 μm; and a blown-up 3D visualization of the co-stained area with VGLUT1 (red) and PSD95 (magenta) puncta, scale bar 1 μm. The bottom panels: only VGLUT1+/PSD95+ puncta with the between-markers distance less than 0.5 μm were selected for analysis. Decreased spatial density of VGLUT1+/PSD95+ puncta after Disc1-KD in astrocytes (Student two-tail t-test,t = 2.177, *- P = 0.039); increased distance from VGLUT1+ spots to the astrocyte surface (Student two-tail t-test, t = −2.491, *- P = 0.020), N = 15–18 images/2–3 sections per mouse/4 mice per group. (D) The upper panels: 3D visualization of GABAergic spots near the astrocyte surface within a single astrocyte zone; VGAT (red) and Gephyrin (magenta) spots puncta, scale bar—5 μm; a blown-up 3D visualization with VGAT (red) and Gephyrin (magenta) spots, scale bar 1 μm. The bottom panels: Only VGAT+/Gephyrin+ spots with the between-markers distance less than 0.5 μm were selected for analysis. Increased spatial density of VGAT+/Gephyrin+ puncta after Disc1-KD in astrocytes (Student two-tail t-test, t = 2.381, *- P = 0.041); no changes in distance from VGAT+ spots to the astrocyte surface; N = 8–9 images/2 sections per mouse/4 mice per group.
