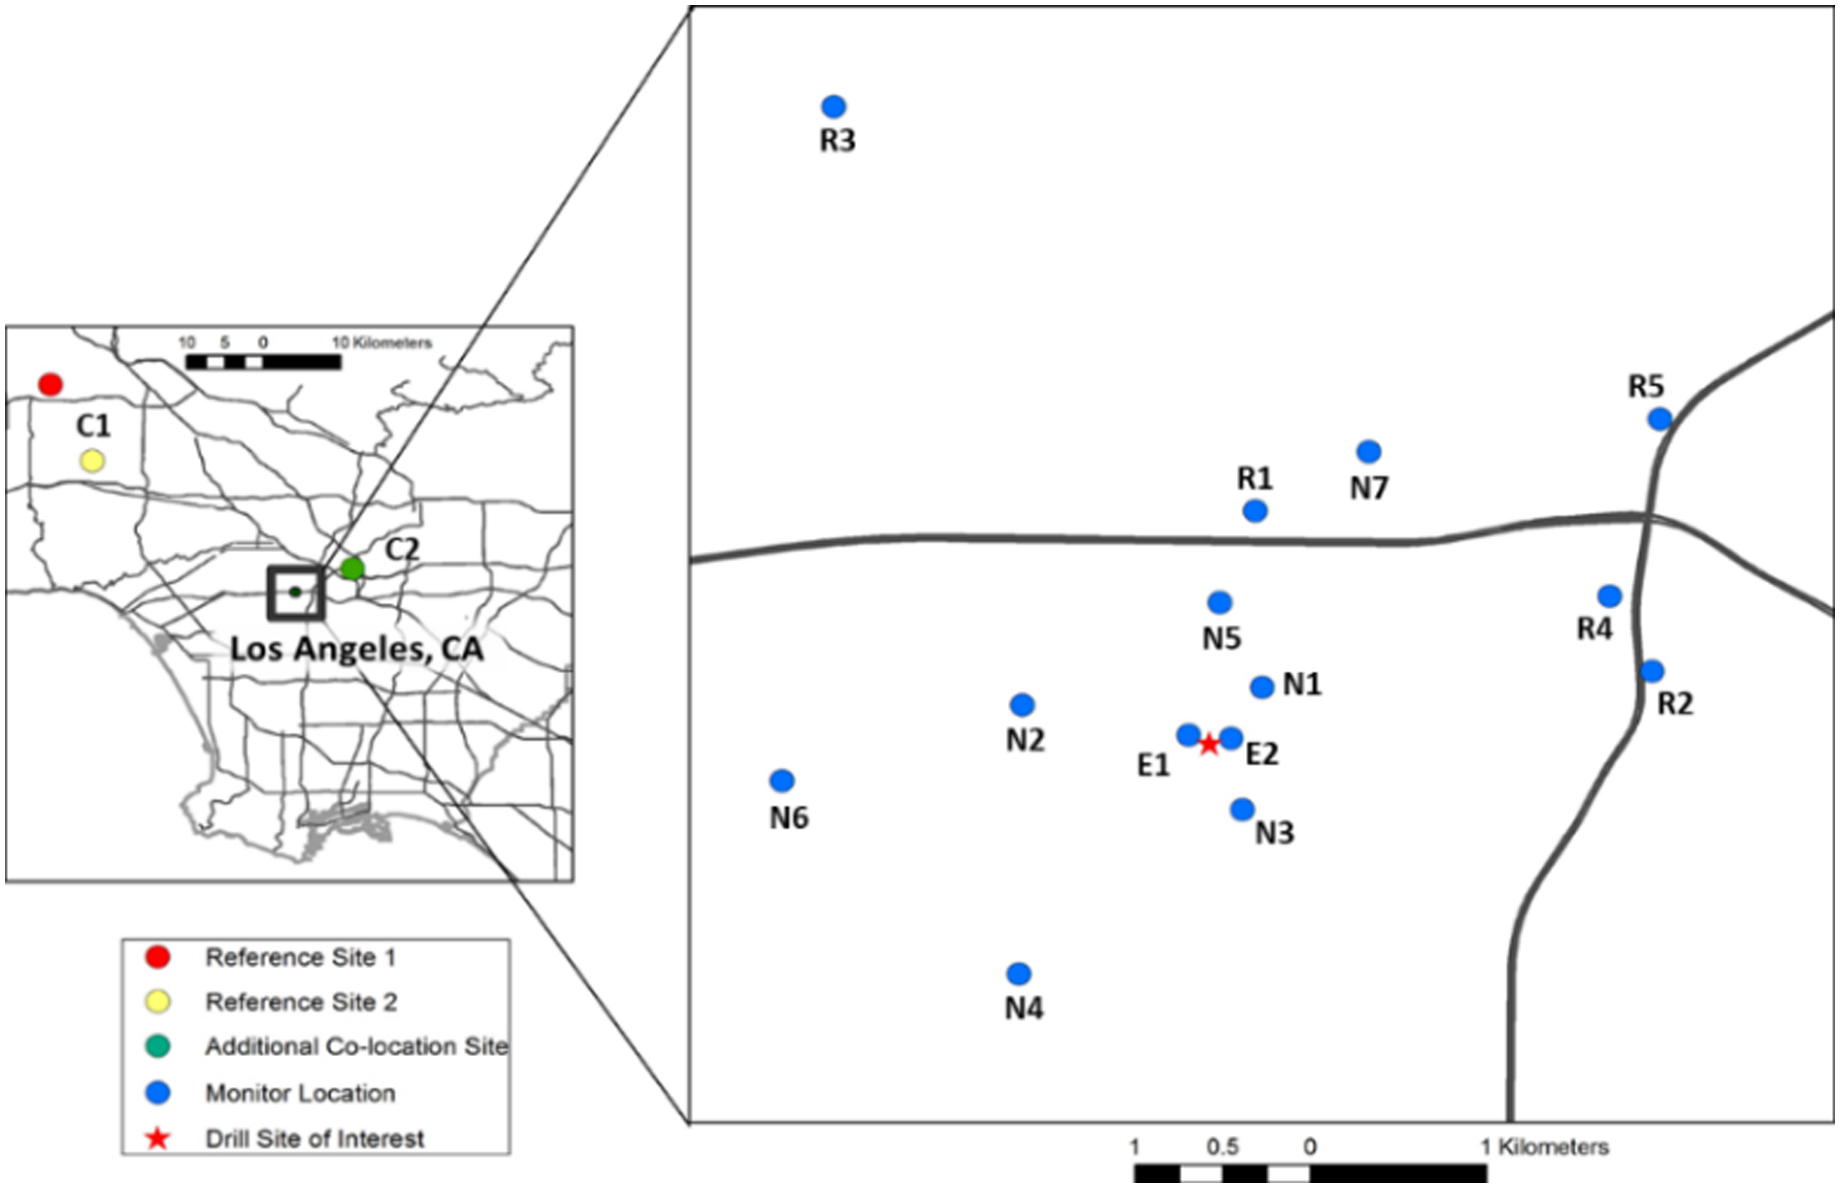
Figure 1:

Map of sampling sites and major sources of interest. Note that the Y-Pod locations have been approximated to the center of their respective blocks in order to protect participant identities. The first initial is indicative of the site type: N – neighborhood site, R – near roadway site, E – near oil extraction site, C – ongoing co-location site (note, Reference Site 1 was not used throughout the field deployment and thus does not have an additional label associated with a Y-Pod).
