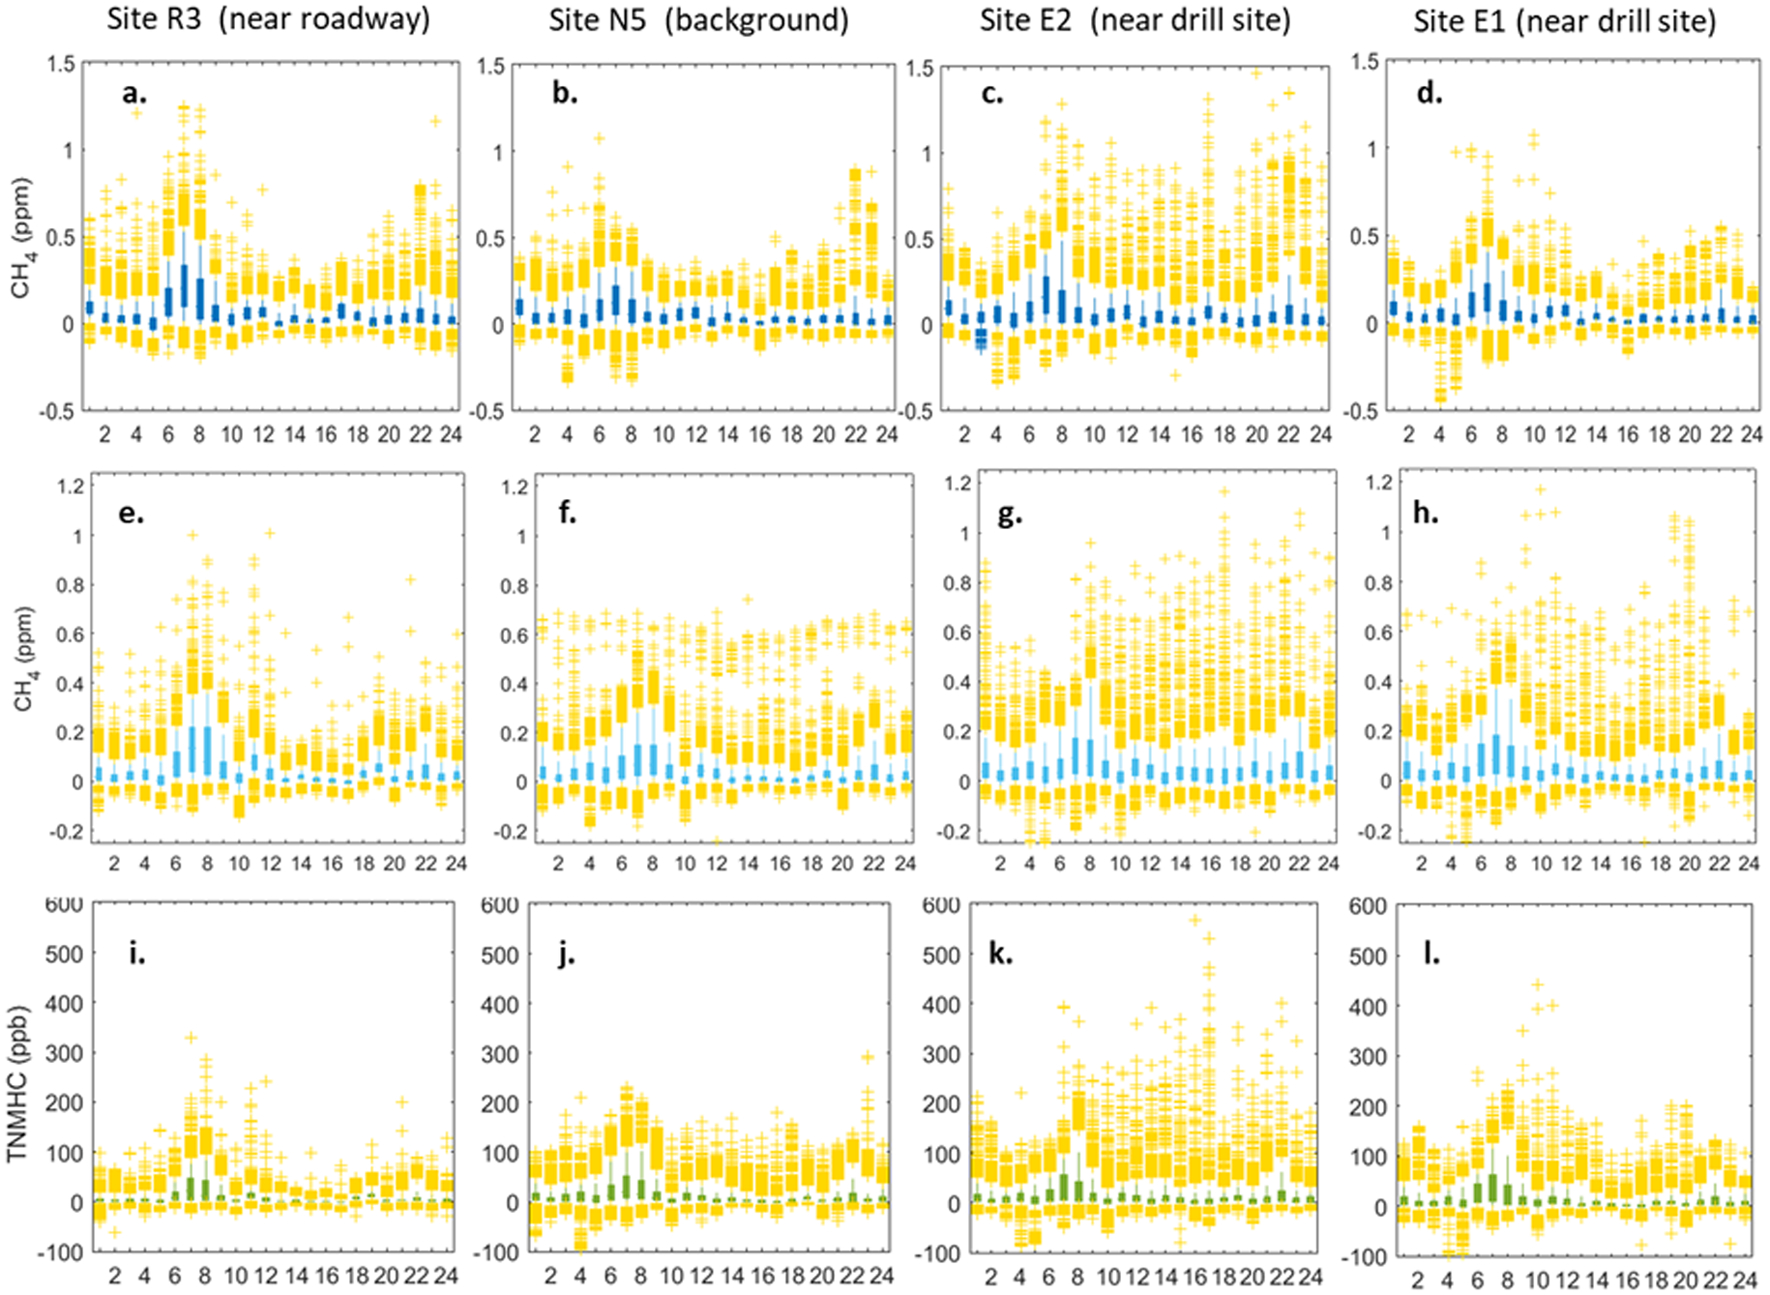
Figure 9. Baseline-removed data from four sites grouped by hour of the day (in local time), panels a-d) include the single sensor CH4 data, panels e-h include the multi-sensor CH4 data, and panels i-l) include the multi-sensor NMHC data. The whiskers on the box plots represent the 5th and 95th percentiles respectively. The top and bottom 5th percent of the data are indicated by yellow markers across all plots.

Referencing data from other types of sensors, similar to the examples in Section 3.3.1, again reveals periods of agreement and disagreement between the sensor responses. The increases in the early morning and evening hours seen at the four sites in Figure 9 also appear in the CO2 and CO sensor data shown in Figure 10. However, the increases in the late-morning and afternoon hours are not reflected in the data for these two pollutants. The timing of this pattern may provide insight into potential sources. Researchers studying the spatial variability of CH4 determined that increases in ground level CH4 can be indicative of sources up to 8.4 km away at night, but only 240 m away during the day (Bamberger et al., 2014). This study emphasized the ability of daytime mixing to disperse pollutants, suggesting that increases or episodic events observed during the afternoon are likely the result of relatively local sources as opposed to more distant sources. Thus, it is possible that the afternoon increases observed during this study are not only the results of a vented or volatilized source, but also the result of local emissions.
