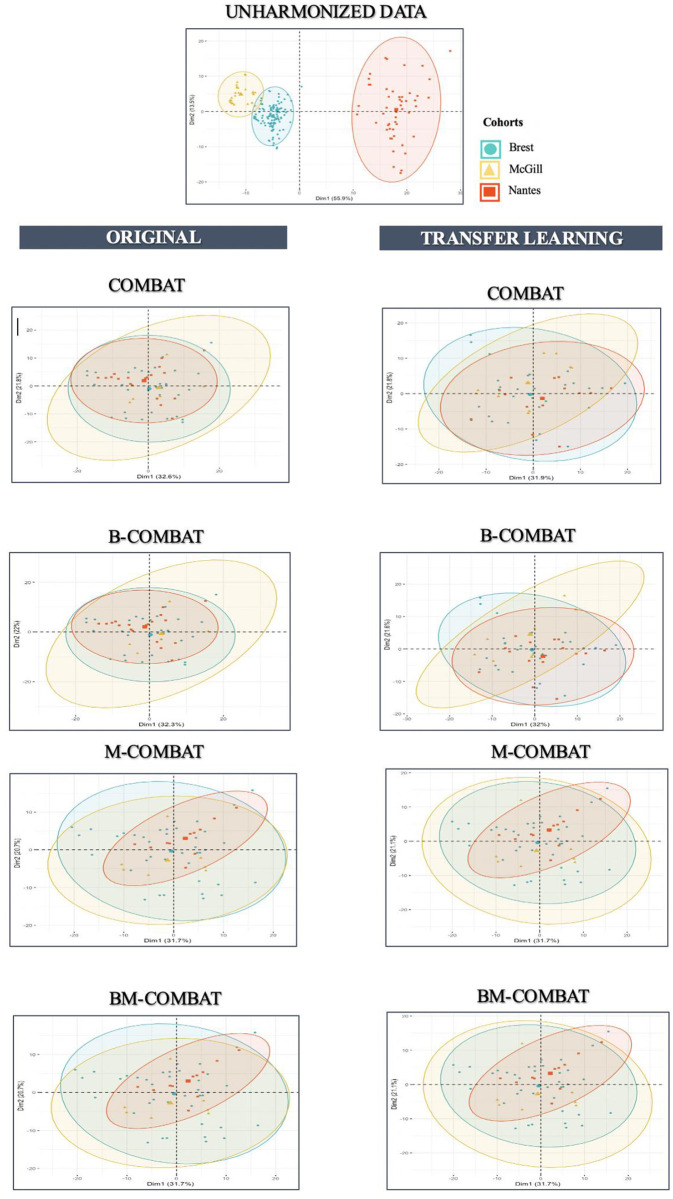
Fig 3. PCA and summary distribution in Experiment 1 in MRI.
Scatter plots of top 2 principal components of the radiomic features across the three labels (centers) using data transformed with the 4 versions of ComBat (using R (3.5.1) and R Studio (1.1.456,R Studios Inc., Boston,MA) https://cran.r-project.org/).

