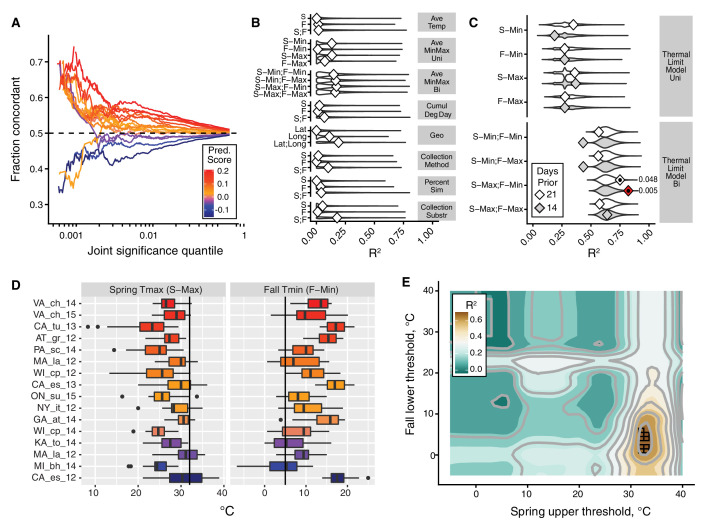
Figure 3. The thermal limit model.
The thermal limit model argues that weather in the weeks prior to sampling can explain variation in the predictability of allele frequency change. (A) Each line represents the comparison between one population and the remaining 19. The x-axis represents the upper threshold of quantile-ranked p-values from the single-population test (Fisher’s exact test) and the 19-population test (GLM), e.g., the top 1% in both tests. The y-axis is the fraction of SNPs where the sign of allele frequency change in the single population test matches the average sign change among the remaining 19. The color scheme represents the slope of this line and is used as a summary statistic for each population. (B, C). We regressed the summary score from (A) onto a number of characterizations of average temperature (B, first four rows), geography (B, fifth row), technical (B, sixth to 8th rows), and thermal extremes (C), considering weather 14. Diamonds represent the observed R2 for (B) and observed maximum R2 across all thermal limits for (C). Violin plots represent the expected distribution of R2 based on permutations. The red diamond represents the model with nominal p-value<0.01. The empirical p-values for these models are listed next to the corresponding red diamond. The 14 day model that uses the counts of hot spring days and cold fall days has a false discovery rate of 17% based on multiple testing correction across all environmental models. (D) The distribution of spring maximum (S-Max) daily temperature and fall minimum (F-min) daily temperature in the 2 weeks prior to sampling. Discordant (blue) populations do not cluster in time or space. Populations shown here are those in which we have weather data (15 populations, in total). (E) The stand-out model uses the number of hot spring days and cold fall days. To determine the optimal threshold for what defines hot and cold, we systematically varied the upper and lower thermal limits from 0°C to 40°C and used the count of hot spring (x1) and cold fall (x2) days as independent, additive variables in a regression model; the genome-wide predictability score was used as the dependent variable (y). The best-fit model uses a spring max (S-Max) temp of ~32°C and a fall min (F-Min) temp of ~5°C and explains ~82% of the variation in the population predictability scores.

