. 2021 Jun 21;10:e67290. doi: 10.7554/eLife.67290

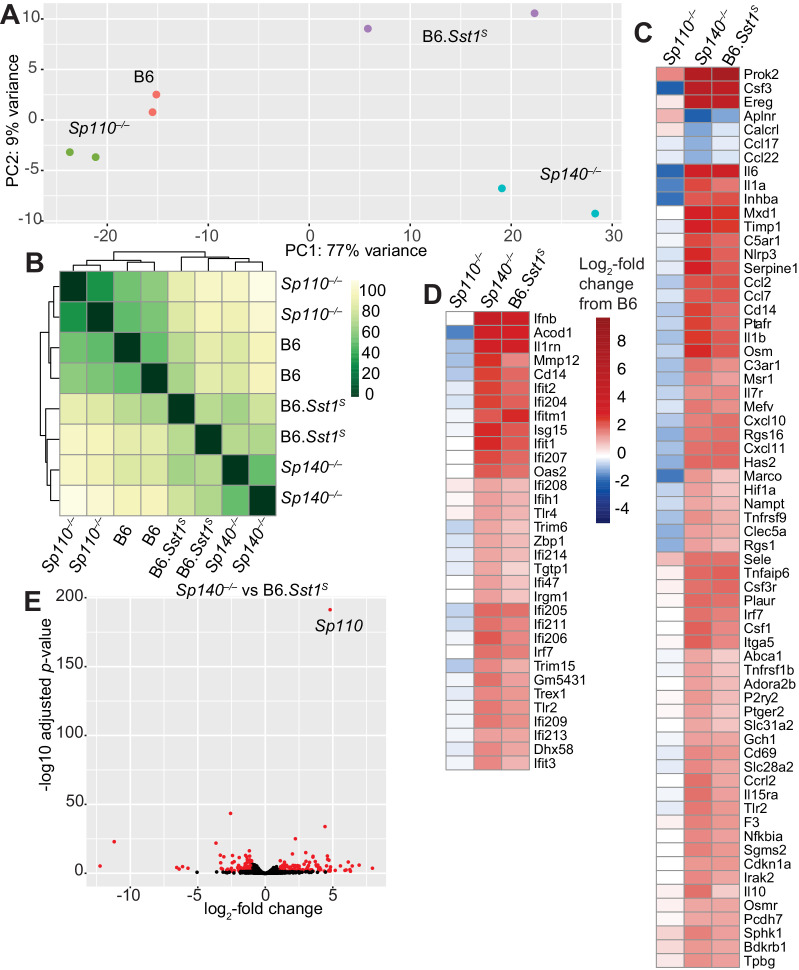
Figure 4. Global gene expression analysis of Sp110–/–, Sp140–/–, and B6.Sst1S lungs after Mycobacterium tuberculosis infection.

(A) PCA or (B) Euclidean distance analysis of all the samples. (C, D) Heatmaps of gene expression in log2-fold change from M. tuberculosis-infected B6. Genes shown are those significantly different between Sp140–/– and B6. (C) GSEA Hallmark inflammatory response; and (D) GO type I IFN response genes. (E) Volcano plot comparing Sp140–/– to B6.Sst1S expression. Dots in red are twofold differentially expressed with adjusted p-value ≤0.05. PCA, principal component analysis.

Figure 4.

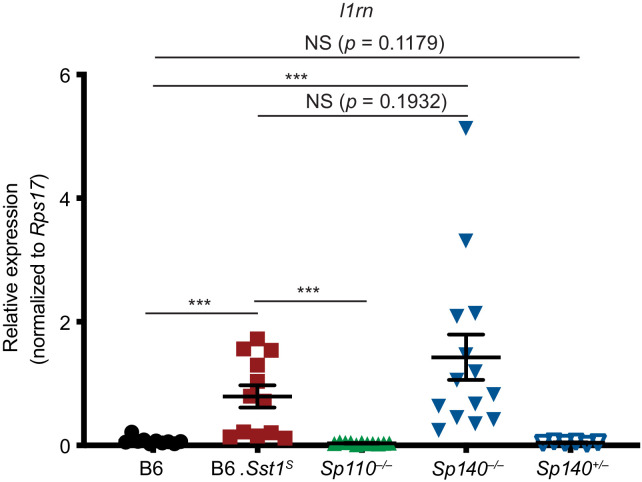
Figure 4—figure supplement 1. B6.Sst1S and Sp140–/– lungs exhibit elevated transcript levels of the interferon-stimulated gene Il1rn during Mycobacterium tuberculosis infection.

Figure 4—figure supplement 1.

RT-qPCR for Il1rn (encodes IL-1Ra) extracted from lungs at 28 days post-infection with M. tuberculosis. Combined results of two independent experiments. Mann-Whitney test. *p≤0.05; **p≤0.01; ***p≤0.005. RT-qPCR, real-time quantitative polymerase chain reaction.
Figure 4—figure supplement 2. Expression of SP family members in Sp140–/– and Sp110–/– mouse lungs during Mycobacterium tuberculosis infection.

Figure 4—figure supplement 2.

Log2-fold change and adjusted p-value for SP family members (Sp100, Sp110, and Sp140) from RNA-seq of M. tuberculosis-infected lungs from Sp110–/– and Sp140–/– mice, compared to B6 and B6.Sst1S.