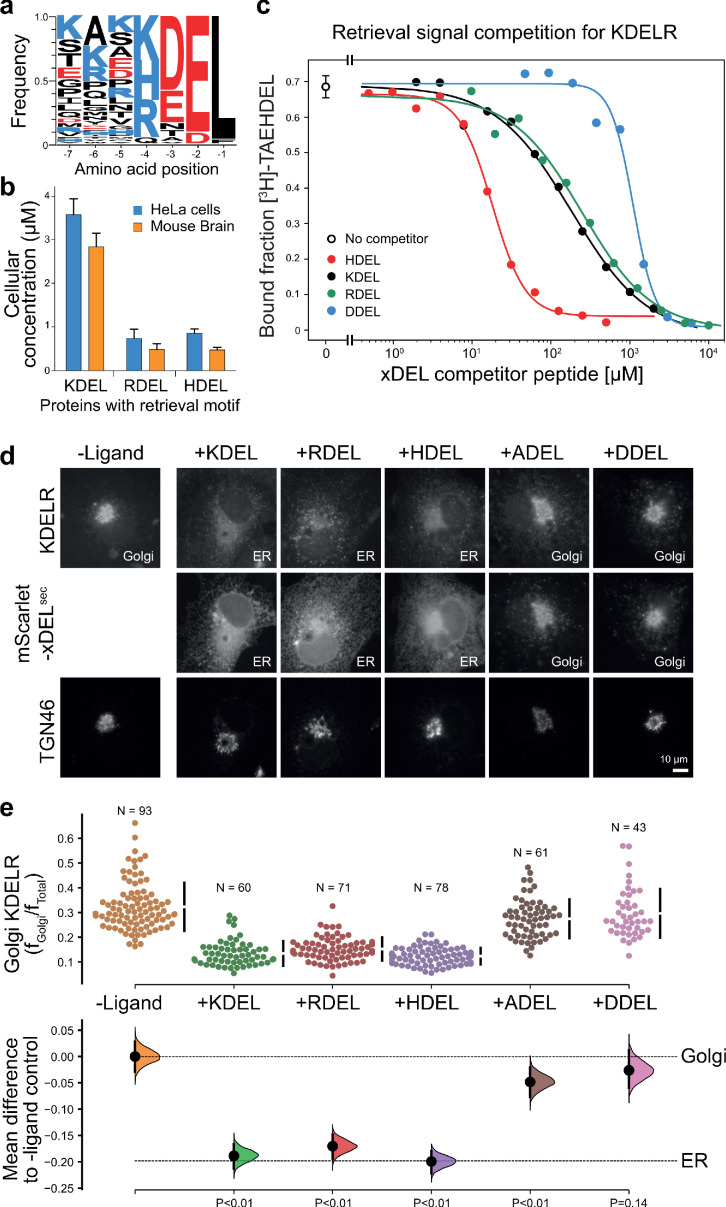
Figure 1. ER retrieval signal abundance and affinity are not correlated.
(a) Sequence logos for ER resident proteins with C-terminal KDEL retrieval signals and variants thereof calculated using frequency or protein abundance (Itzhak et al., 2017; Itzhak et al., 2016). (b) Combined cellular concentrations of ER resident proteins with canonical KDEL, RDEL, and HDEL retrieval sequences in HeLa cells and mouse brain. (c) Competition binding assays for [3H]-TAEHDEL and unlabelled TAEKDEL, TAERDEL, and TAEHDEL to the KDEL receptor. IC50 values for the competing peptides were used to calculate the apparent KDwith the Cheng-Prusoff equation (Cheng and Prusoff, 1973). (d) Endogenous KDEL receptor redistribution was measured in COS-7 cells in the absence (-ligand) or presence of K/R/H/A/DDEL (mScarlet-xDELsec). TGN46 was used as a Golgi marker. Scale bar is 10 µm. (e) The mean difference for K/R/H/A/DDEL comparisons against the shared no ligand control are shown as Cummings estimation plots. The individual data points for the fraction of KDEL receptor fluorescence in the Golgi are plotted on the upper axes with sample sizes and p values.


