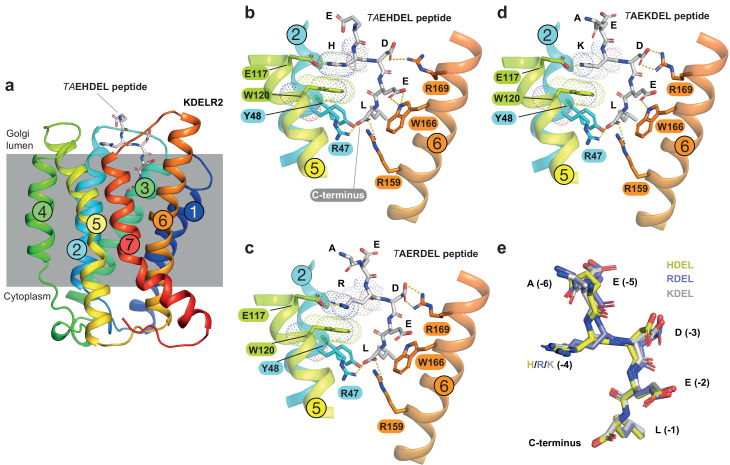
Figure 2. Structures of the KDEL receptor bound to HDEL and RDEL retrieval signals.
(a) Crystal structure of chicken KDELR2 viewed from the side with the transmembrane helices numbered and coloured from N-terminus (blue) to C-terminus (red). The predicted membrane-embedded region of the receptor is indicated by a grey shaded box, with labels at the luminal and cytoplasmic faces. The TAEHDEL peptide is shown in stick format, coloured grey. (b) Close up views of bound TAEHDEL (this study), (c) TAERDEL (this study), and (d) TAEKDEL (PDB:6I6H) peptides bound to the receptor are shown with contributing side chains labelled. Hydrogen bonds are indicated as dashed lines. The molecular orbitals of W120 and the −4 histidine on the peptide are shown as a dotted surface. (e) Superposition of the HDEL, RDEL, and KDEL peptides reveals near identical binding position within the receptor. Retrieval signal side chains are numbered counting down from the C-terminus.


