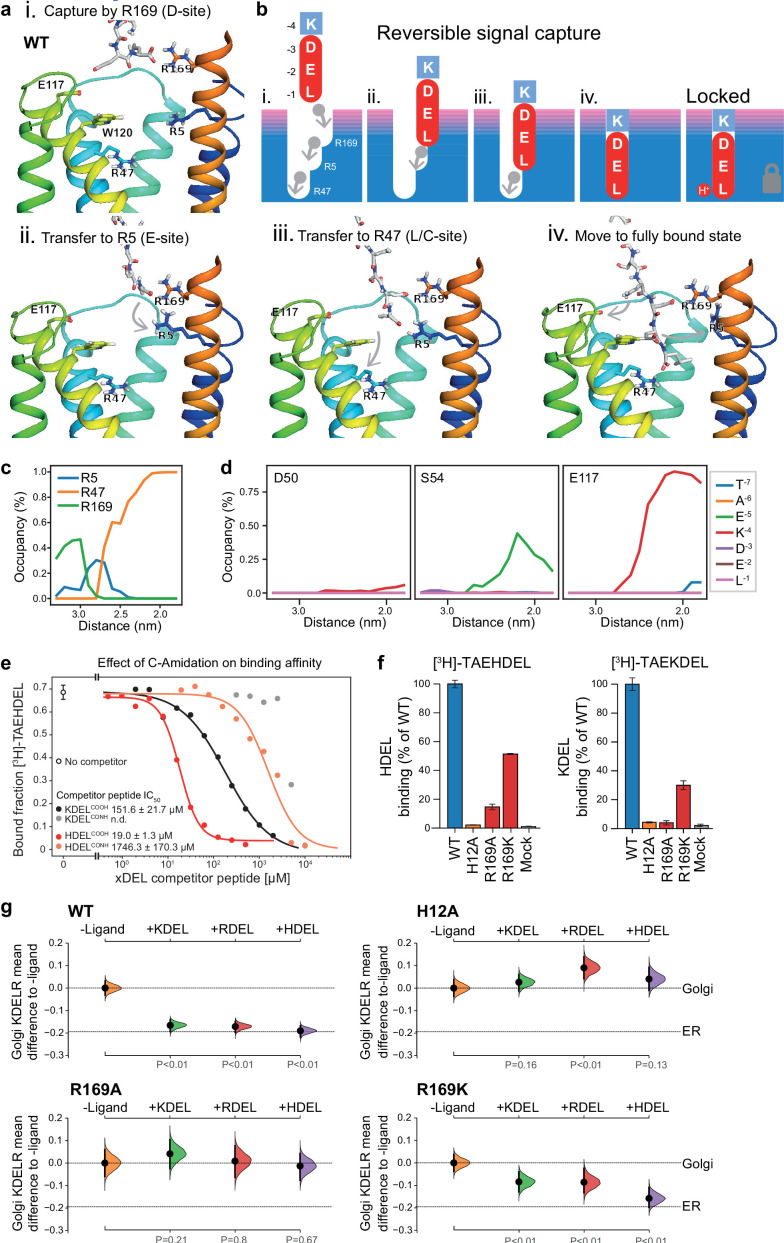
Figure 7. Mechanism for initial retrieval signal capture by the KDEL receptor.
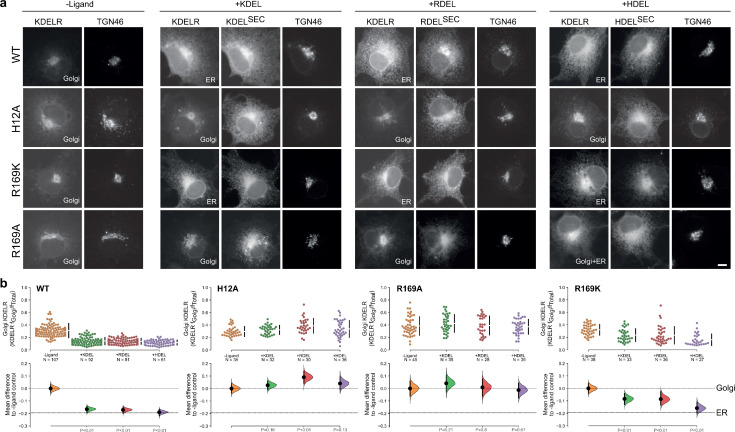
(a) Images depicting the key stages (i.-iv.) of TAEKDEL binding to the wild-type (WT) KDEL receptor simulated using molecular dynamics. Initial engagement of the C-terminus to R169 (i) is followed by transfer to R5 (ii), shortly followed by interaction of E −2 with R169 (iii). Finally, R47 engages the C-terminus allowing D −3 to interact with R169 (iv). See also Video 1. (b) A carton model depicting the key stages of retrieval signal binding and final pH-dependent locked state. (c) Occupancy of the hydrogen bonds between the C-terminus of the KDEL retrieval signal and R5, R47, and R169 is plotted as a function of signal position within the binding pocket. (d) The occupancy of potential hydrogen bonds between the different positions of the KDEL retrieval signal and D50, S54, and E117 is plotted as a function of signal position within the binding pocket. (e) Competition binding assays for [3H]-TAEHDEL and unlabelled TAEKDEL and TAEHDEL with a free (COOH) or amidated (CONH) C-terminus to chicken KDELR2 showing IC50 values for the competing peptides. (f) Normalised binding of [3H]-TAEHDEL and [3H]-TAEKDEL signals to the purified WT H12A, R169A, or R169K mutant chicken KDELR2. A mock binding control with no receptor indicates the background signal. (g) Distribution of WT, H12A, R169A, and R169K KDEL receptors was measured in COS-7 cells in the absence (-ligand) or presence of K/R/HDELsec. The mean differences for K/R/HDEL comparisons against the shared no ligand control are shown with sample sizes and p values. See also Figure 7—figure supplement 1 with accompanying source data.


