Fig. 1.

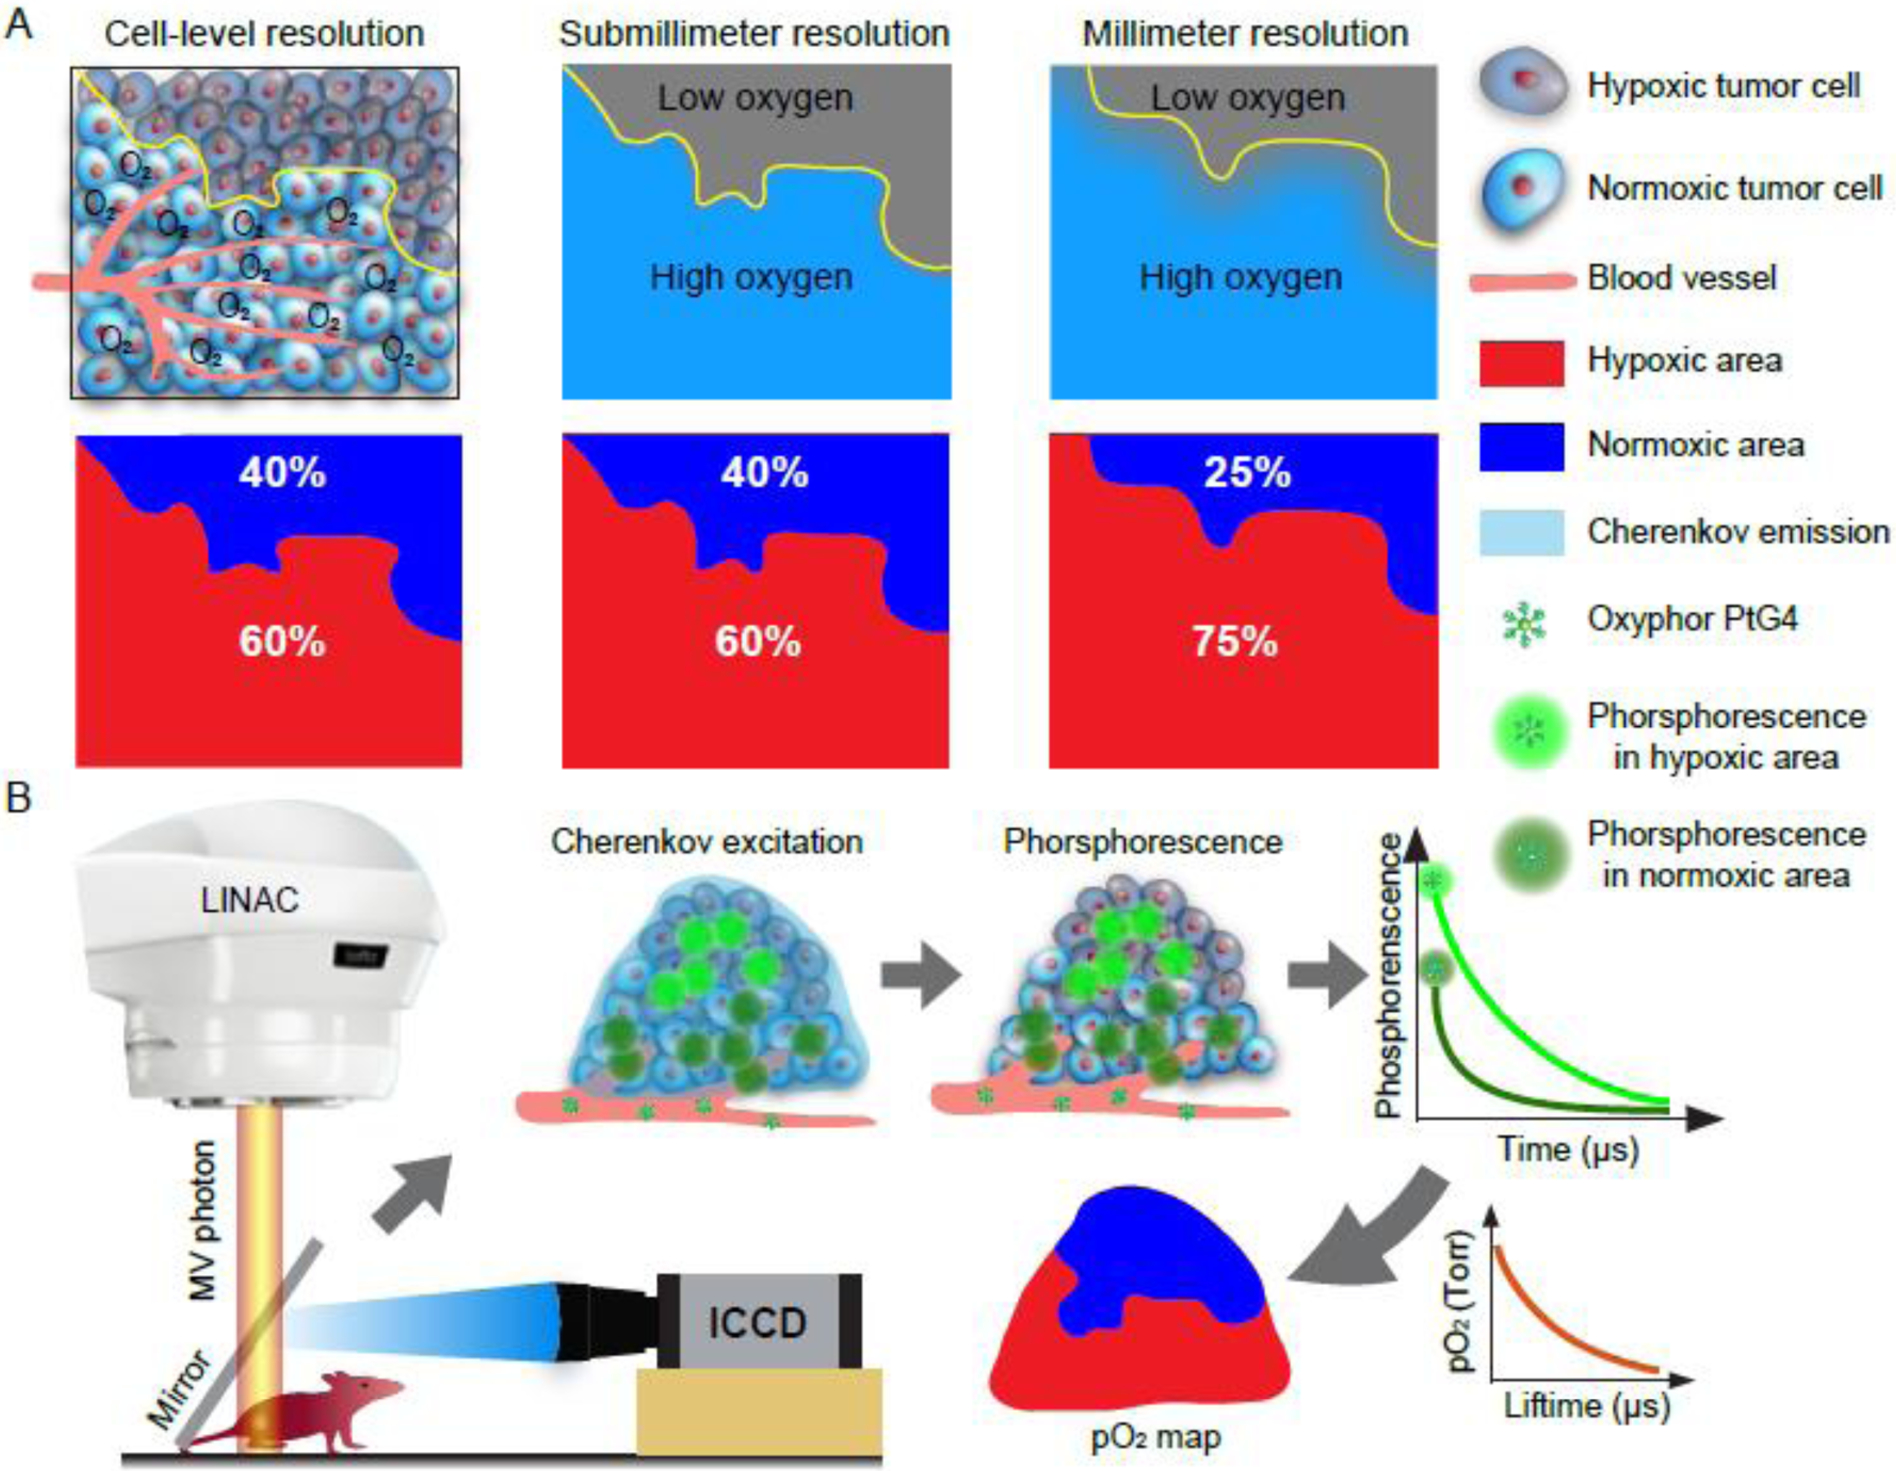
(A) Schematic diagram shows the influence of spatial resolution on the estimation of the hypoxic fraction. (B) Workflow diagram of in vivo pO2 imaging based on Cherenkov Excited Luminescence Imaging (CELI).

(A) Schematic diagram shows the influence of spatial resolution on the estimation of the hypoxic fraction. (B) Workflow diagram of in vivo pO2 imaging based on Cherenkov Excited Luminescence Imaging (CELI).