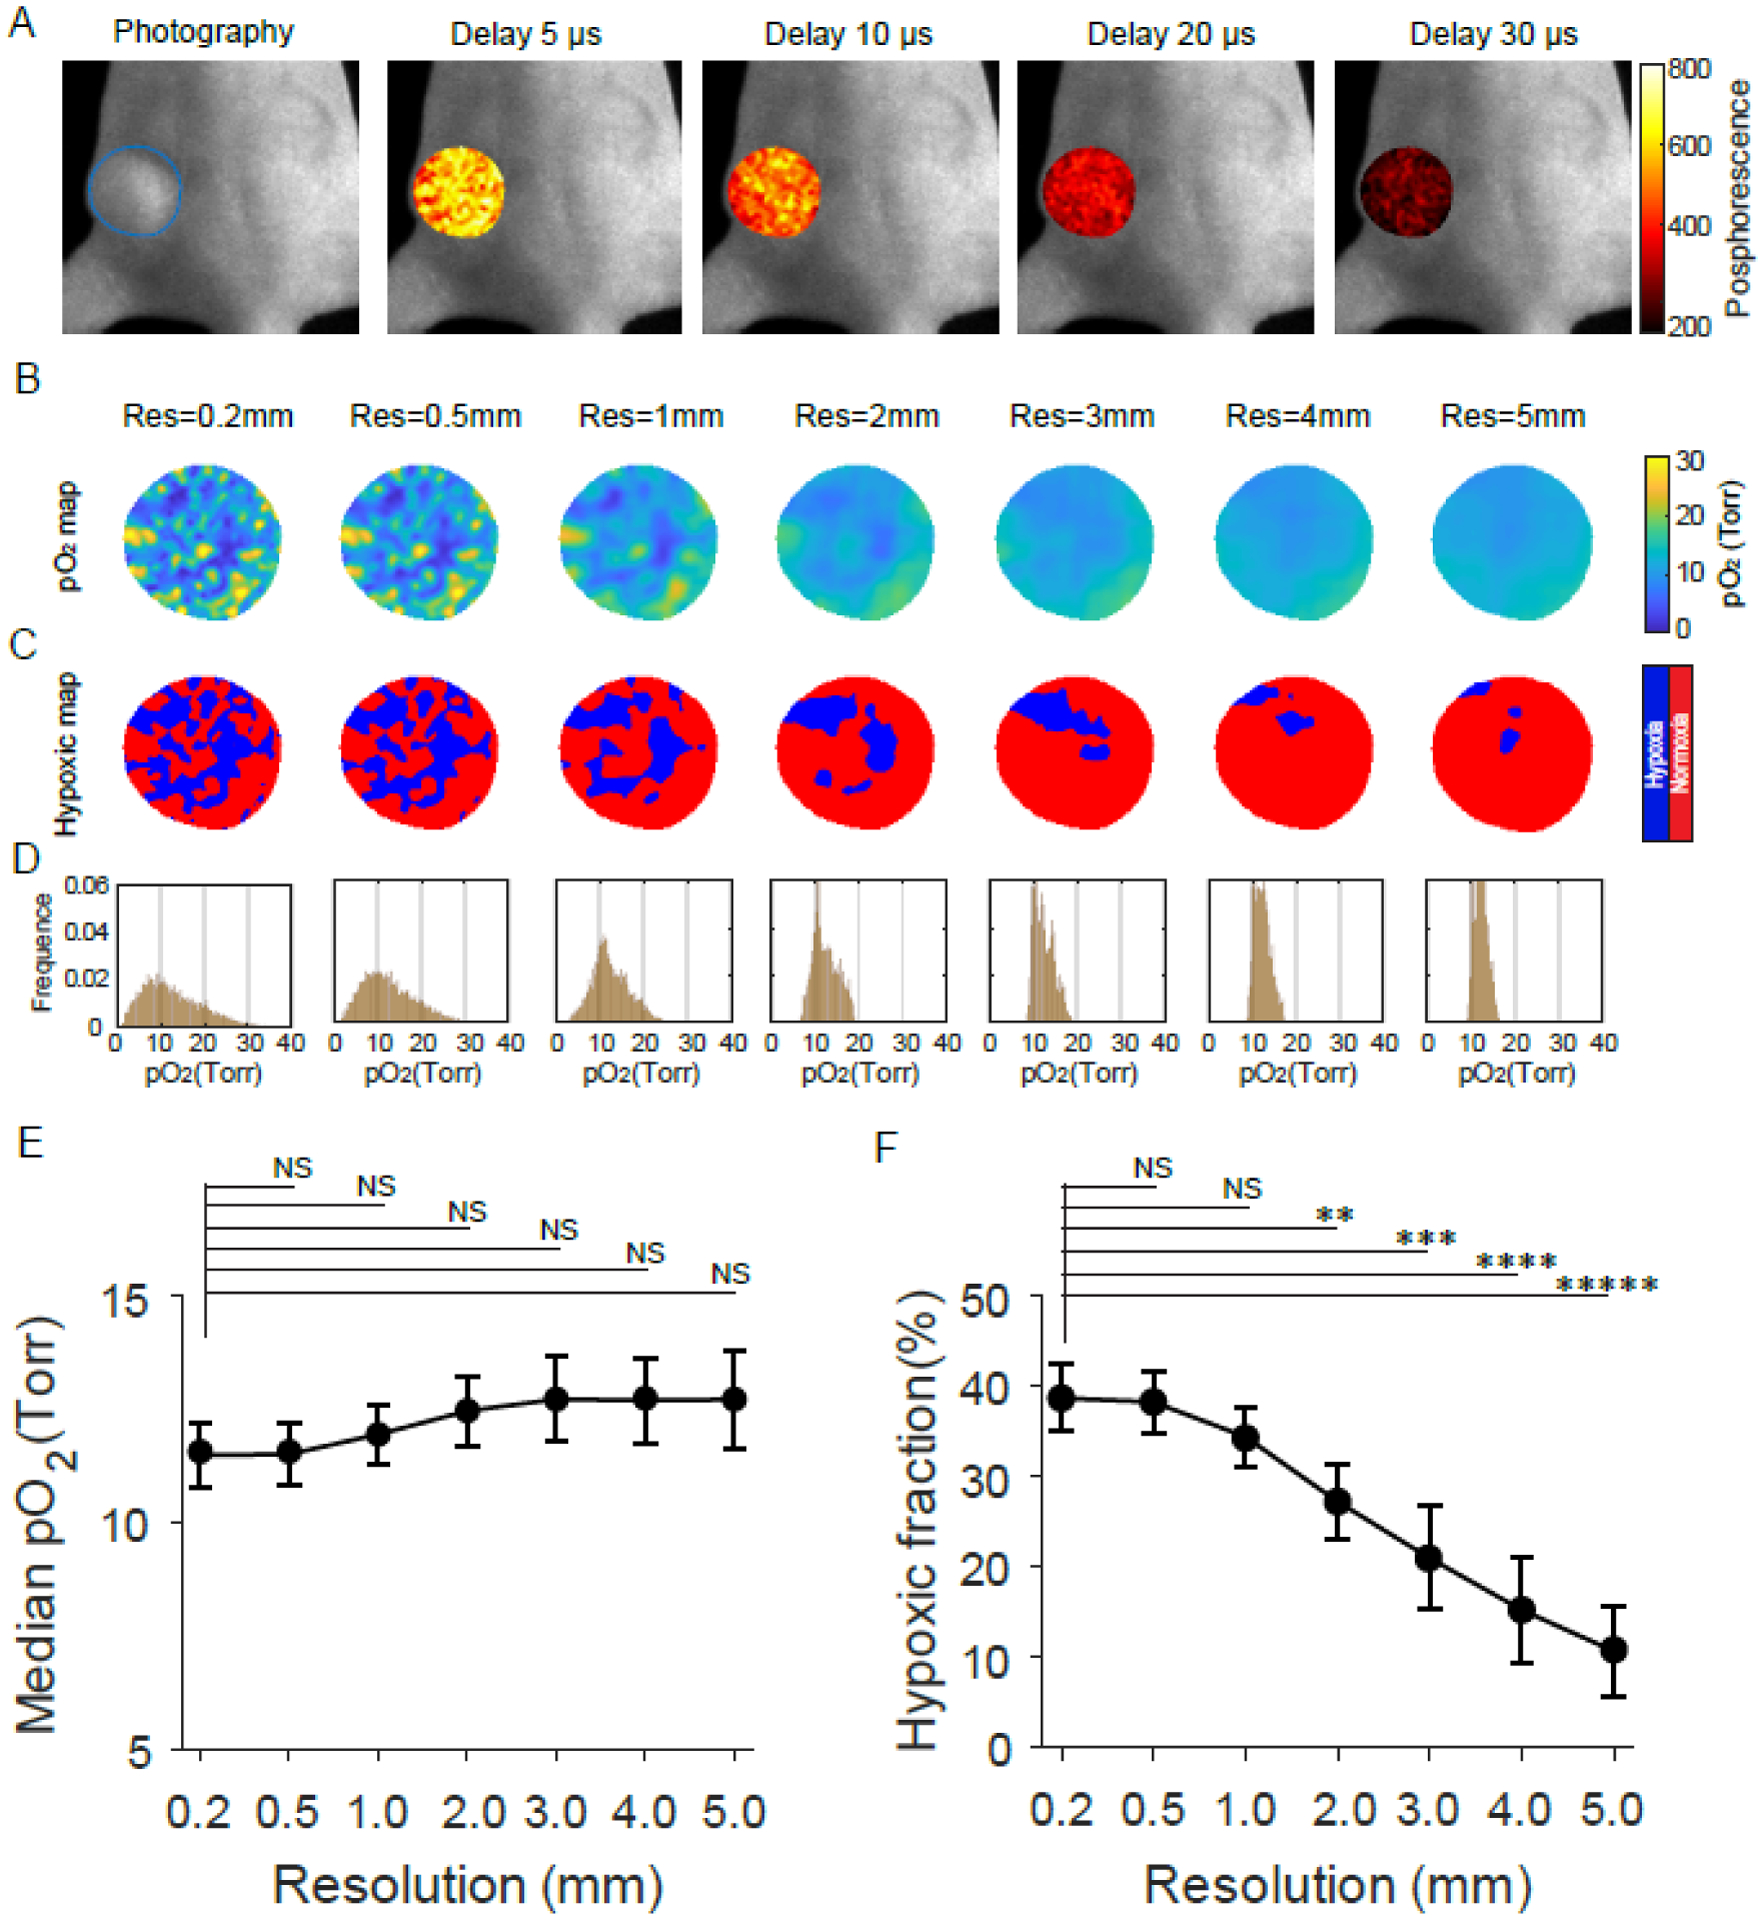
Fig. 3.

In vivo assessment of tumor oxygen parameters based on pO2 imaging at different spatial resolutions. (A) Phosphorescence intensity images acquired at different time delays relative to the radiation pulse during radiotherapy. (B to D) The pO2 maps (B), Hypoxic maps (C), and pO2 histograms (D) of the tumor for different spatial resolutions. (E and F) Median pO2 values (E) and hypoxic fractions (F) of tumors changed with the spatial resolutions. Data in (E) and (F) are means ± std (n = 5). A paired t-test was used for statistical analysis with significance denoted by: *P < 0.01, ***P < 0.00001, ****P < 0.000001, and NS meaning no significance.
