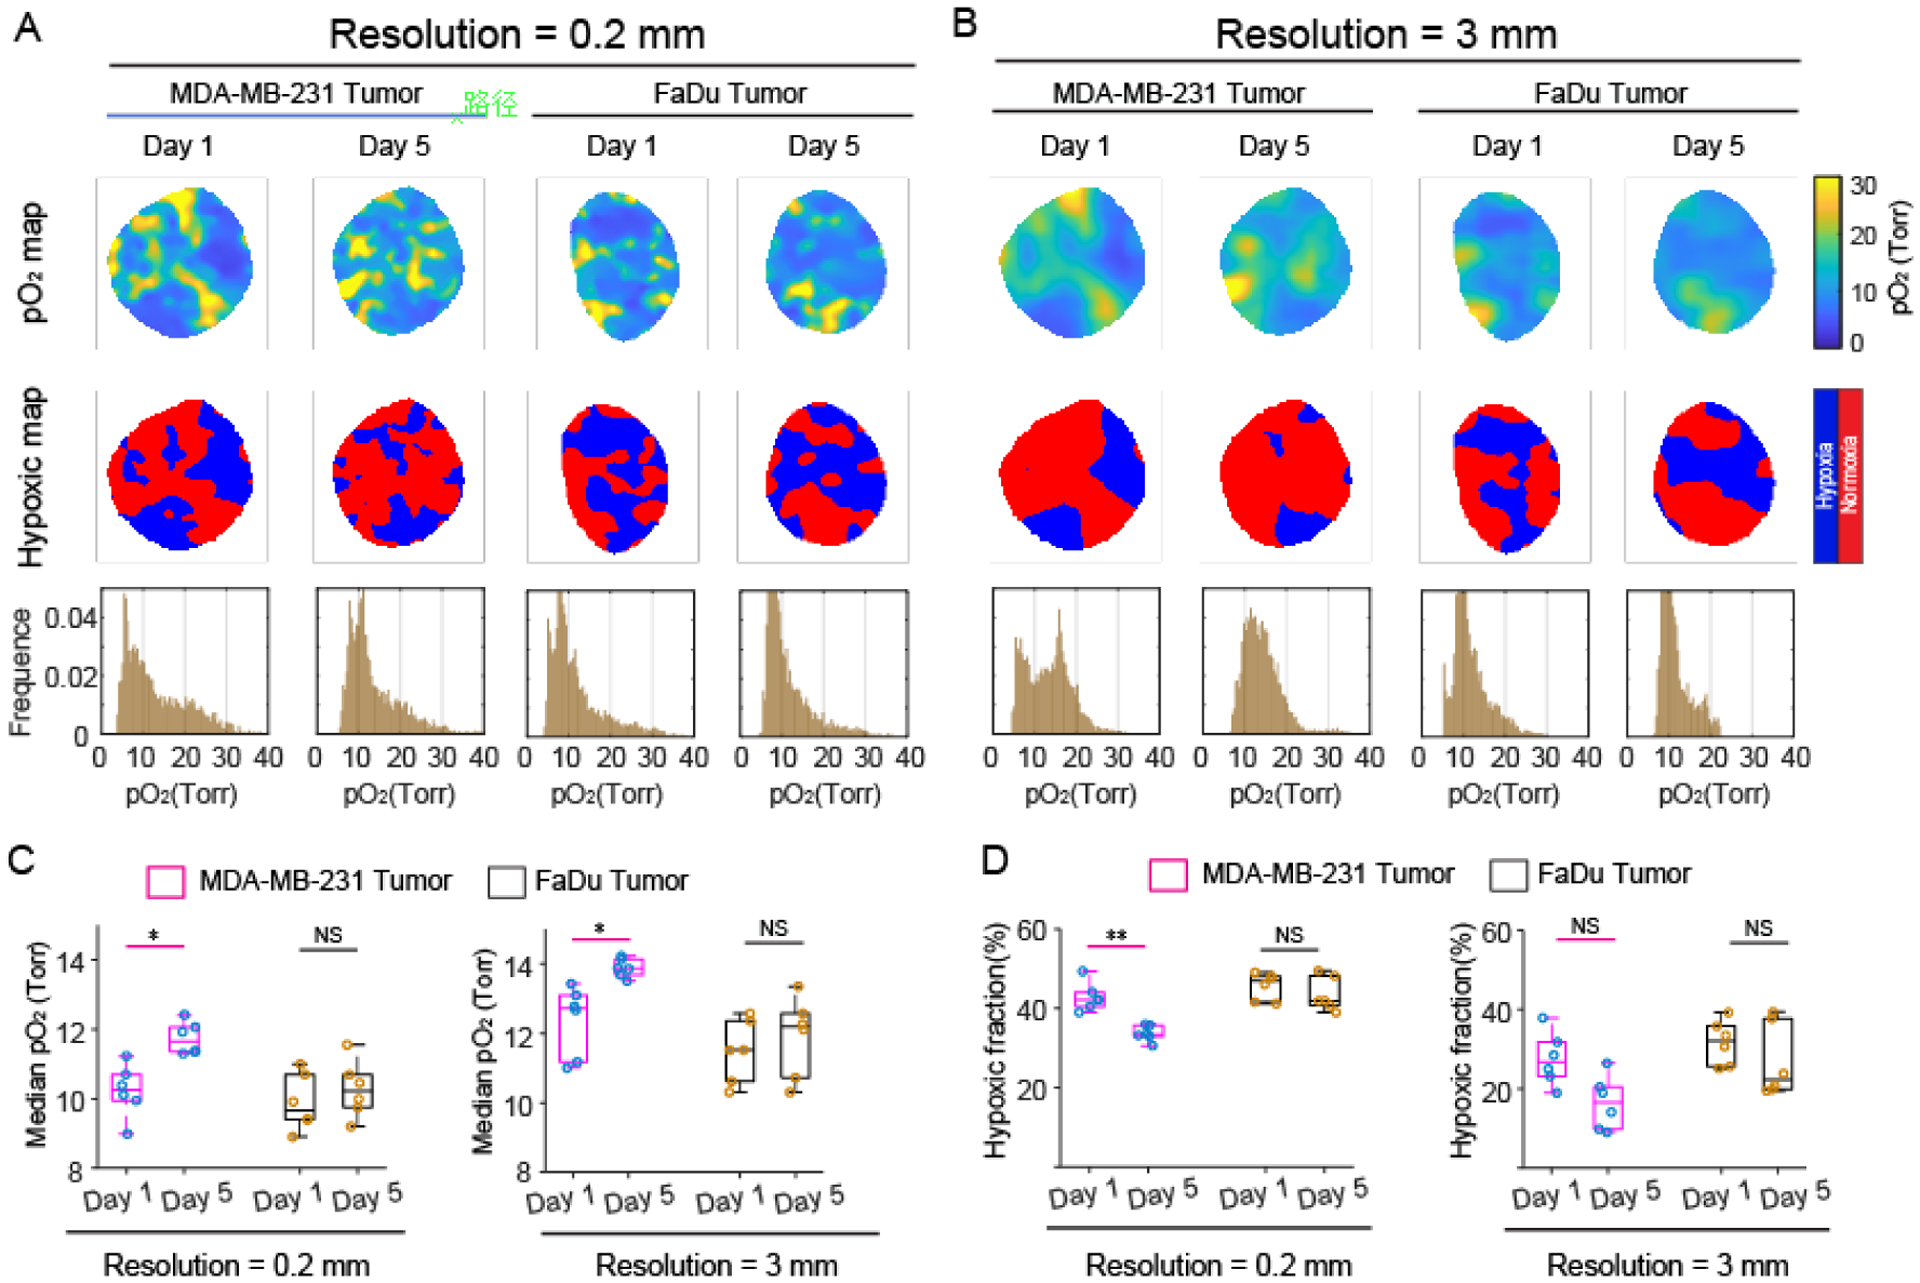
Fig. 4.

Assessment of oxygen parameter changes during hypofractionated radiotherapy in MDA-MB-231 and FaDu tumors with two spatial resolutions. (A and B) The pO2 maps hypoxic maps, and pO2 histograms for 0.2 mm (A), and 3 mm (B) spatial resolutions. (C and D) Estimated median pO2 values and (C and D) hypoxic fractions for 0.2mm (left) and 3mm (right) resolutions. A paired t-test was used for statistical analysis (n = 6). *P < 0.01, **P < 0.0001. Boxplot shows median and interquartile range, whiskers indicate the range.
