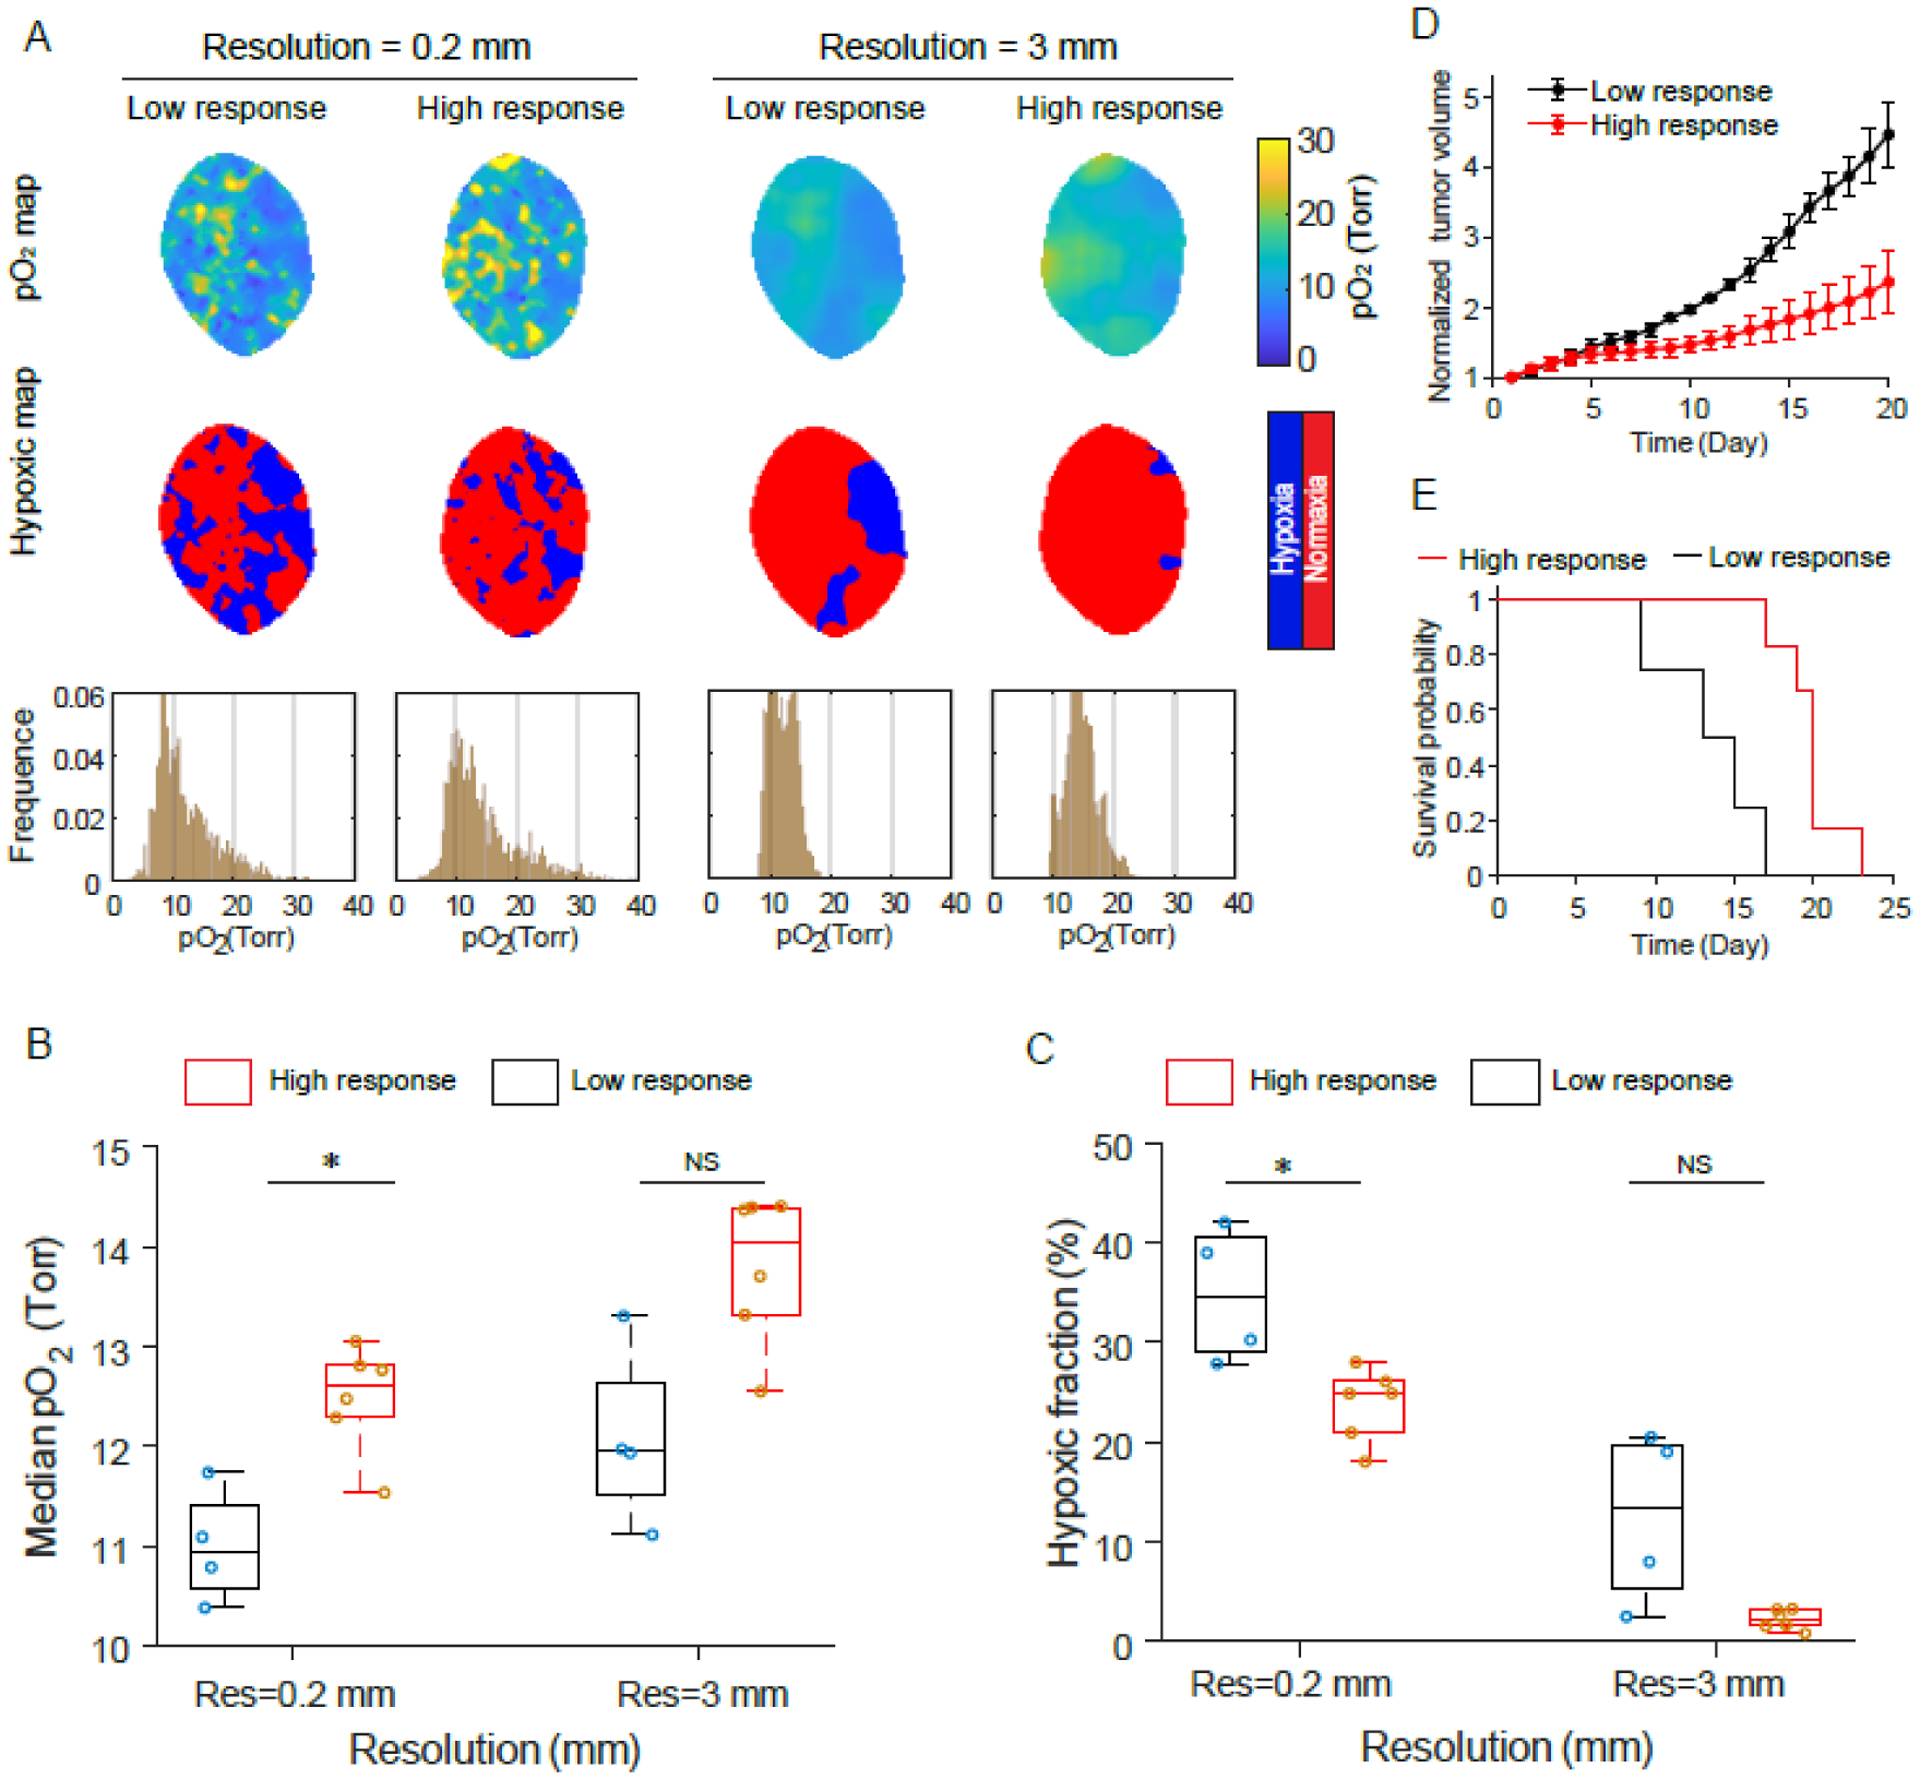
Fig. 5.

Testing predictive value of in vivo pO2 imaging in initial radiotherapy fraction for the final tumor outcome with two spatial resolutions. (A and B) The pO2 maps, hypoxic maps and pO2 histograms for high-response (A) and low-response (B) tumors to radiotherapy. (C and D) Tumor volume growth (C) and survival curve (D) for high-response and low-response tumors. (E and F) Median pO2 values (E) and hypoxic fractions (F) for high-response and low-response tumors with 0.2 mm and 3 mm resolutions. Two-sample t-test was used for statistical analysis. *P < 0.01, ****P < 0.000001. Boxplots show median and interquartile range, whiskers indicate the range.
