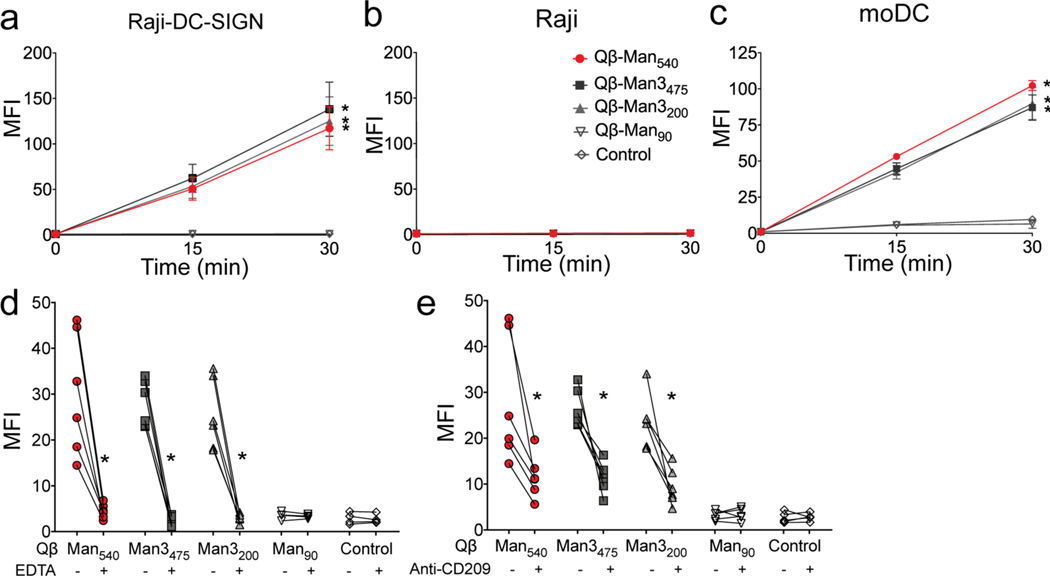
Figure 2. Analysis of VLP interaction with DCs and the role of DC-SIGN.
The internalization of fluorophore-labeled Qβ VLPs functionalized with aryl mannoside, trimannoside, or pentaerythritol (control) was estimated by flow cytometry. Samples tested: (a) Raji-DC-SIGN, (b) Raji cells and, (c) human monocyte-derived dendritic cells (moDC) at indicated time points. Flow cytometry analysis of particle uptake in moDC in the presence or absence of (d) 1 mM EDTA, (e) anti-CD209 (anti-DC-SIGN) antibody 15 min after particle stimulation. The error bars represent standard error of the mean (SEM) from at least two independent experiments. The two-way ANOVA with Dunnett’s multiple comparisons test (a-c) and Wilcoxon matched-paired signed rank test (d, e) were used for data analysis. An asterisk denotes a statistically significant difference (*P<0.05) between the treatment and the control particle (Qβ-PE540) groups (a-c) and between antibody or EDTA treated and non-treated cells (d, e). Mean fluorescence intensity (MFI; arbitrary units) on the Y-axis was normalized to that of unstimulated cells.

