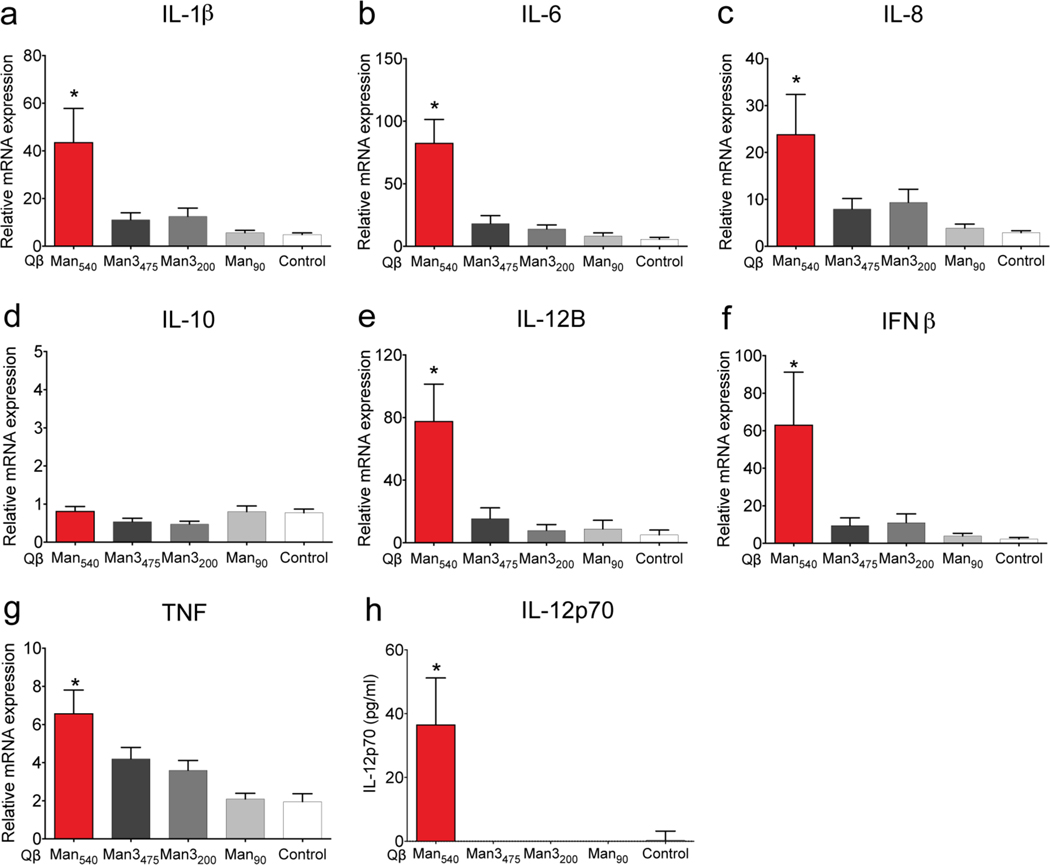
Figure 5. VLP-induced expression of proinflammatory and TH1-type cytokines in moDCs.
(a-g) Quantitative real-time PCR analysis of cytokine mRNA expression in moDCs treated with particles (4 nM) for 6 h. (h) IL-12p70 expression in the supernatant of VLP-treated moDCs (4 nM, 48 h) measured by ELISA. The error bars represent standard error of the mean from at least three independent experiments. One-way ANOVA with Dunnett’s multiple comparisons test was used for data analysis. An asterisk denotes a statistically significant difference (*P<0.05) between the treatment groups and the control particles (Qβ-PE540).

