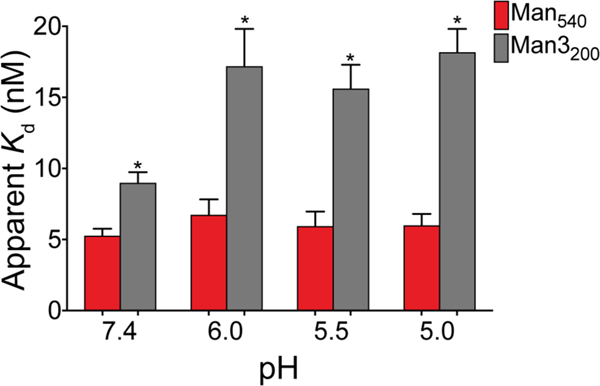
Figure 7. Binding of Qβ-Man540 and Qβ-Man3200 to DC-SIGN at different pH values.
Binding of DC-SIGN ECD to Qβ-Man540 and Qβ-Man3200 was measured by ELISA at pH 7.4–5.0. Apparent dissociation constant (Kd) values were calculated by nonlinear regression curve fit for total binding. The error bars represent standard error of the mean (SEM) from at least three independent experiments.

