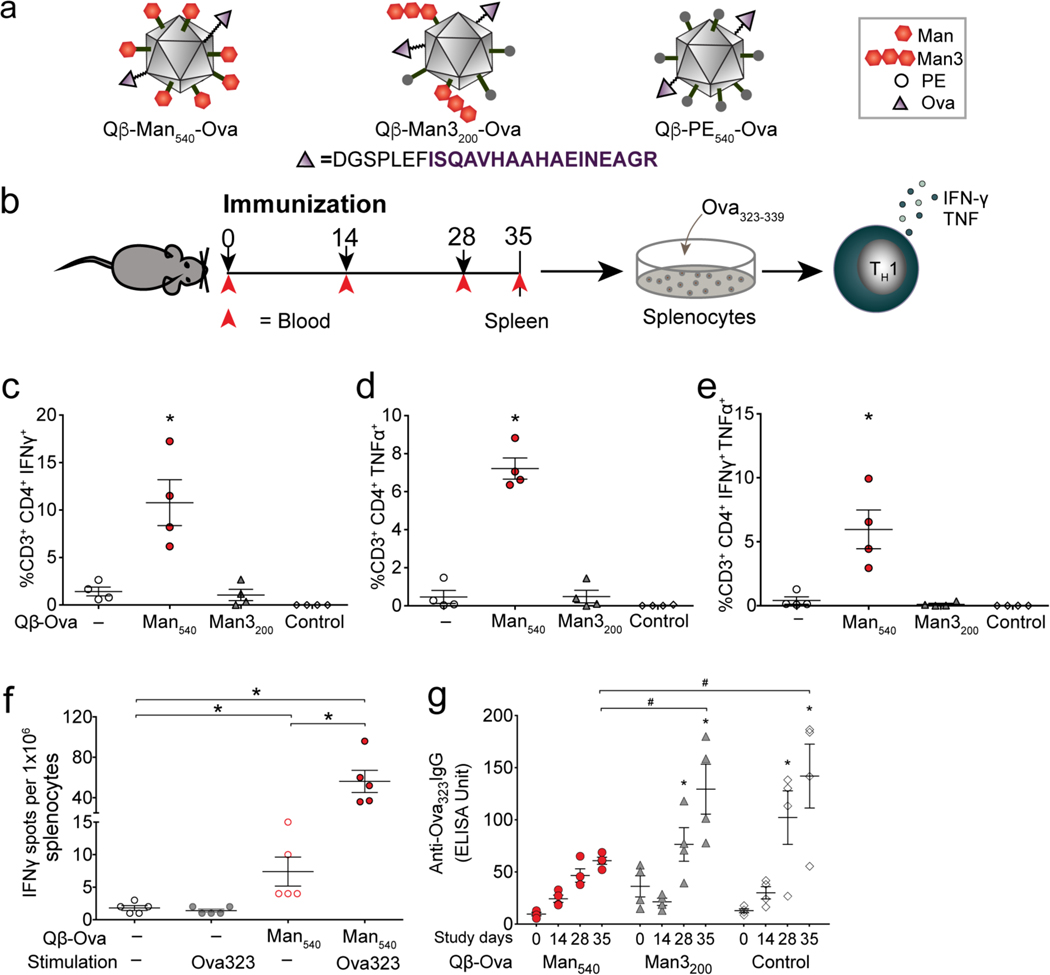
Figure 9. Induction of Th1 type immune responses in vivo.
(a) Qβ VLPs used in the in vivo study. (b) Experimental design: 4 mice per group; 50 μg of Ova323 peptide-functionalized particles per dose; splenocytes and serum analyzed at day 35. (c-e) Intracellular cytokine staining of splenocytes from immunized mice stimulated with Ova323 peptide for 6 h, analyzed by flow cytometry. (f) IFNγ producing splenocytes quantified by ELISPOT. (g) Anti-Ova323-IgG antibody responses in the serum of immunized mice measured by ELISA. Error bars represent standard error of the mean. The one-way ANOVA with Dunnett’s or Tukey’s multiple comparisons test was used for data analysis. * indicates statistically significant difference (P<0.05) between vaccinated and unvaccinated cohorts (c-e) or from baseline (day 0) (g). # indicates a statistically significant difference (P<0.05) between the compared cohorts.

