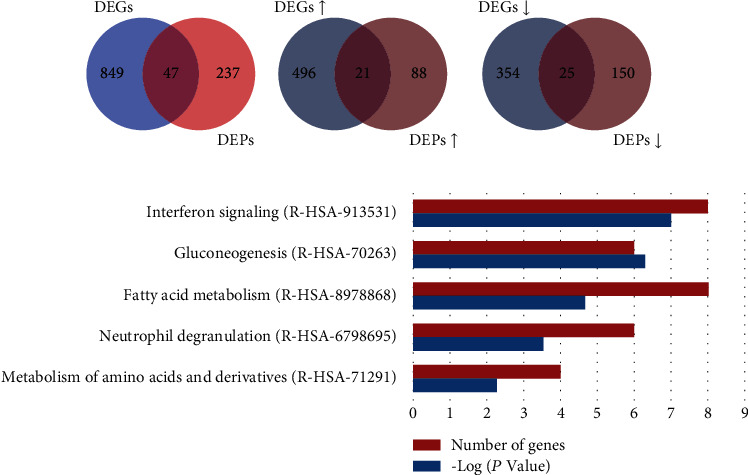
Figure 9.

Comparison and analysis of DEGs and DEPs identified between the control and PEDV groups. (a) The total numbers of DEGs and DEPs identified between the control and PEDV groups. The overlap indicated the numbers of genes identified both in DEGs and DEPs. (b) The total numbers of upregulated DEGs and DEPs. The overlap indicated the number of upregulated genes identified both in DEGs and DEPs. (c) The total numbers of downregulated DEGs and DEPs. The overlap indicated the number of downregulated genes identified both in DEGs and DEPs. (d) The top 5 enriched Reactome pathways among genes identified both in DEGs and DEPs with the same expression pattern. ↑, upregulated; ↓, downregulated.
