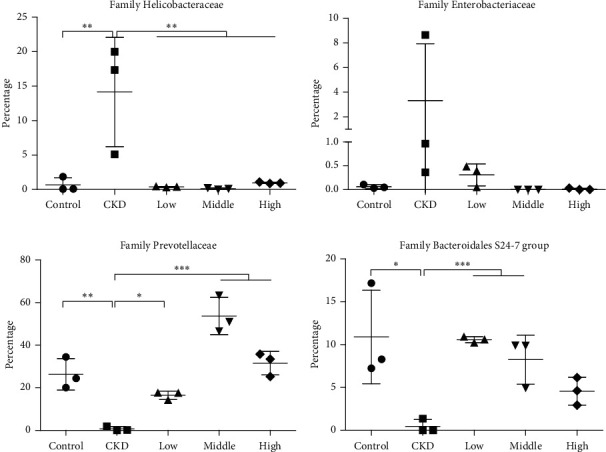
Figure 6.

Plotting of relative abundance of the selected bacteria at the family level. n = 3 for each group. ∗p < 0.05. ∗∗p < 0.01. ∗∗∗p ≤ 0.001.

Plotting of relative abundance of the selected bacteria at the family level. n = 3 for each group. ∗p < 0.05. ∗∗p < 0.01. ∗∗∗p ≤ 0.001.