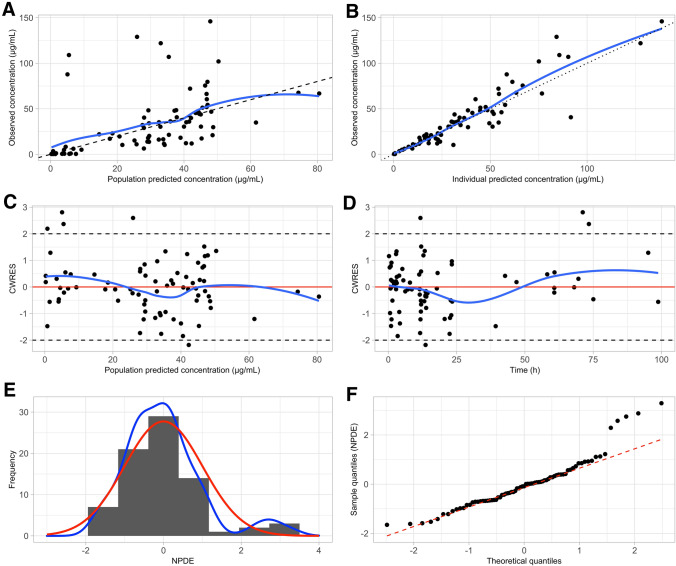
Fig. 2.
a Observed vs population-predicted concentrations and b observed vs individual-predicted concentrations. The solid blue line represents loess smoothing. c Conditional weighted residuals (CWRES) vs population-predicted concentrations and d time. The solid blue line represents loess smoothing. e Distribution of the normalized prediction distribution errors (NPDEs). The solid red line represents a normal distribution, whereas the solid blue line represents the actual distribution of the NPDEs. f QQ plot of NPDEs

