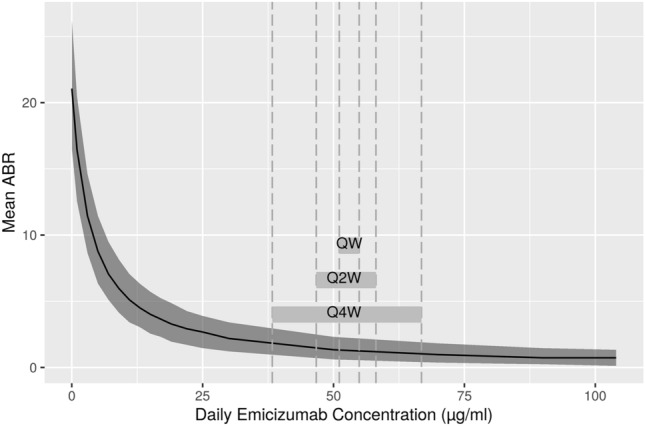
Fig. 4.

Simulated exposure–response analysis of emicizumab. Gray shading around the simulated mean plot lines indicate the 2.5th and 97.5th percent boundaries of the prediction intervals. Gray horizontal bars indicate the simulated range of steady-state mean trough concentrations and mean maximum concentrations over a dosing interval at maintenance doses of 1.5 mg/kg once weekly (QW), 3 mg/kg once every 2 weeks (Q2W), and 6 mg/kg once every 4 weeks (Q4W). ABR annualized bleeding rate
