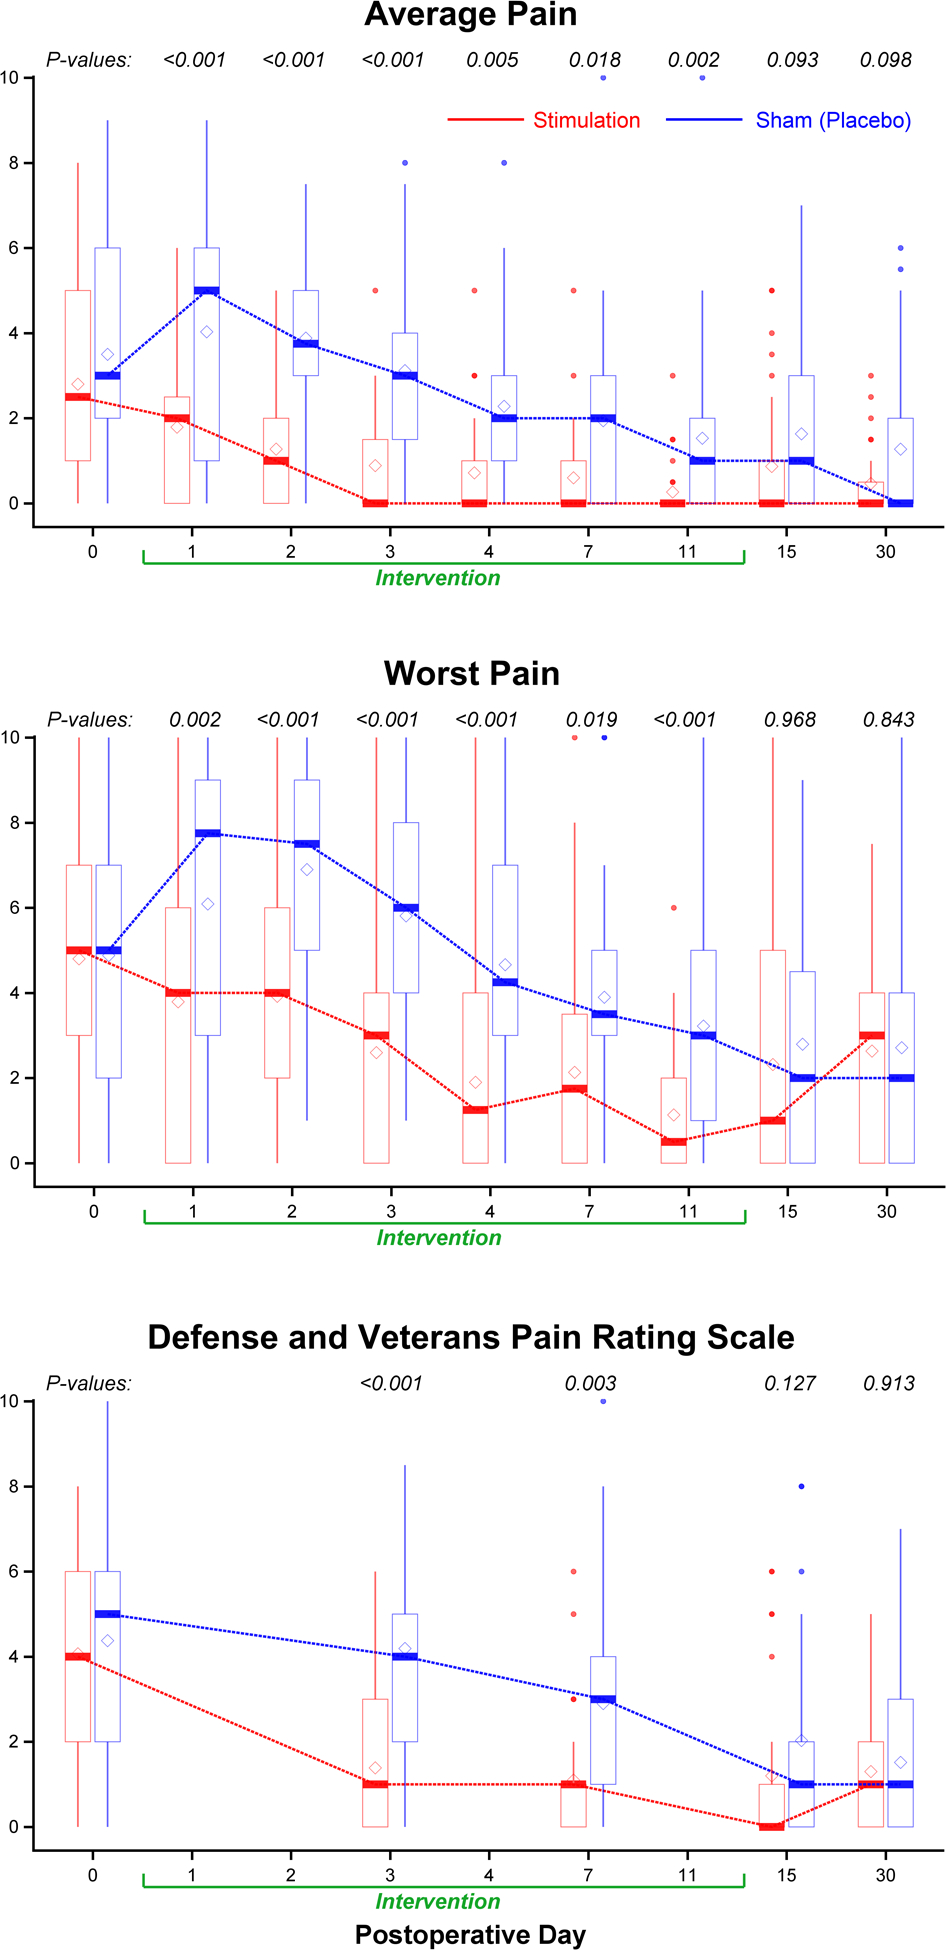
Figure 3.

Effects of 14 days of percutaneous peripheral nerve stimulation on pain. Pain severity is indicated using a numeric rating scale (Panels A and B) the Defense and Veterans Pain Rating Scale (Panel C) with 0 equal to no pain and 10 being the worst imaginable pain. For scores during the initial 7 postoperative days, P values were estimated from repeated measures linear mixed effects model with an autoregressive correlation structure, adjusting for baseline scores and imbalanced surgical location; for postoperative day 11 and 15, P values were estimated from Wilcoxon rank sum test stratified by surgical location; for month 1, P values were estimated from multivariable linear regression models adjusting for baseline scores and surgical location. Data expressed as median (dark horizontal bars) with 25th–75th (box), 10th–90th (whiskers), mean (diamonds), and outliers (circles).
