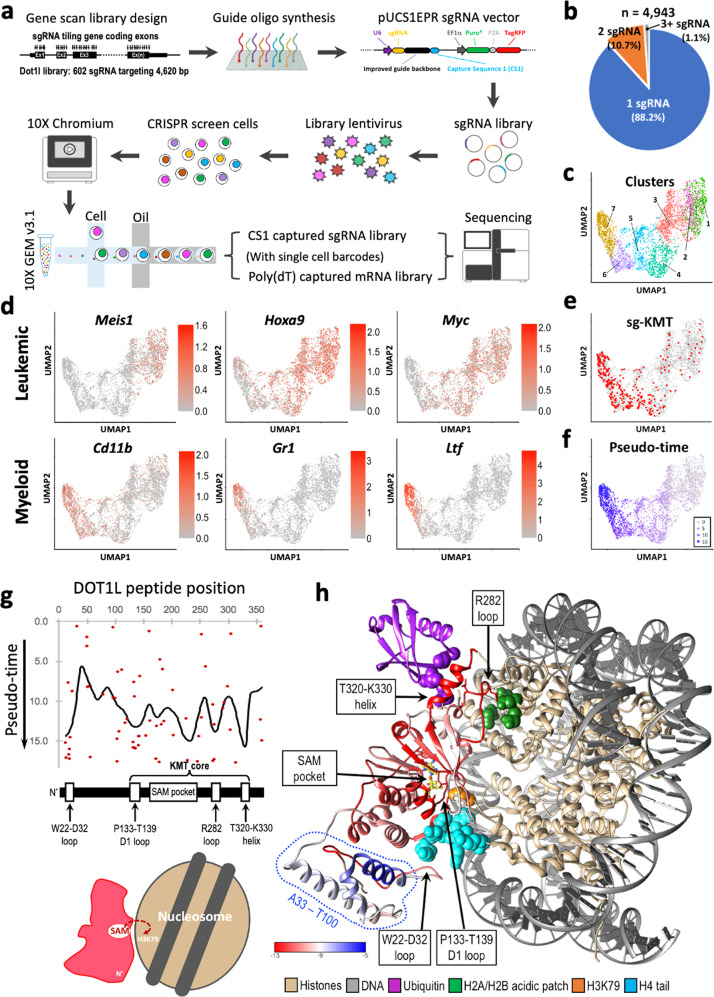
Fig. 1. Single-cell CRISPR gene tiling of DOT1L.
a Schematic outline of sc-Tiling library construction and screening in MLL-AF9-Cas9+ cells. b Assignment rates for direct-capture sgRNA. The total number of cells and fraction of cells assigned a single guide, two guides, or more than two guides are indicated. c Two-dimensional projection (UMAP) of cell clusters based on sc-RNAseq of DOT1L-dependent genes. The transcriptionally distinguishable cell populations (1–7) are color labeled. d Annotation of leukemia-associated (Meis1, Hoxa9, and Myc) and myeloid-differentiation (Cd11b, Gr1, and Ltf) gene expression on UMAP. e, f Annotation of e cells harboring sgRNAs targeting the DOT1L KMT core (red) and f pseudo-time value (purple gradient) on UMAP. g Median pseudo-time of each sgRNA constructs (dots) and the smoothed pseudo-time score (line) of the KMT core. h Three-dimensional annotation of smoothed pseudo-time score relative to a cryo-EM structural model of “active state” DOT1L (residues M1–P332) bound to a ubiquitylated nucleosome (PDB ID: 6NQA; and a simplified scheme shown on the bottom-left)27. Histones (gold; including H2A, H2B, H3, and H4), DNA (gray), ubiquitin (purple; conjugated to histone H2BK120; DOT1L contact points on ubiquitin are labeled as purple spheres), histone H4 N-terminal tail (cyan spheres), the enzymatic substrate SAM (colored sticks), histone H3K79 (orange spheres), and an H2A/H2B acidic patch (green spheres) are shown. Enlarged images are shown in Supplementary Fig. 5. Source data are available in the Source Data file.

