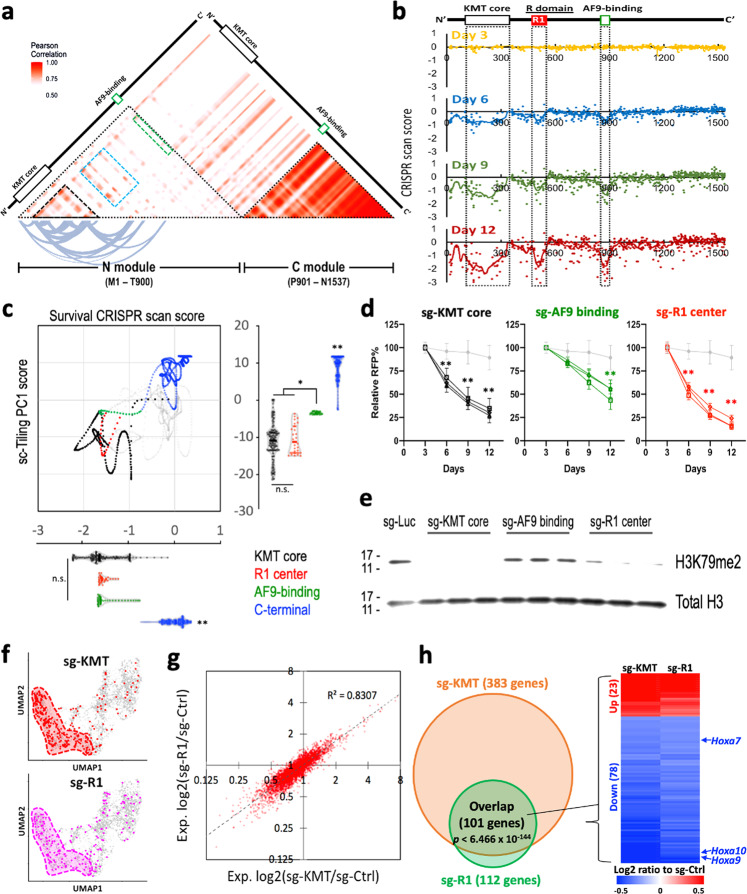
Fig. 2. sc-Tiling pinpoints functional elements in DOT1L.
a Heatmap depicts Pearson correlations between sgRNAs targeting different positions across the DOTL1 protein. The curved lines indicate highly correlative (Pearson score >0.8) residue pairs in the N-module of DOT1L. b CRISPR scan score of each sgRNA (dots) and smoothed score (line) of the DOT1L-tiling survival screen in MLL-AF9-Cas9+ leukemia at the indicated number of days in culture. c Combinational analysis of the sc-Tiling principal component 1 (PC1; y-axis) and survival CRISPR scan score (day 12; x-axis) of individual amino acid residues (dots) in DOT1L. Residues compose of R1 center (E489–L515; red dots) correlate with the KMT core (black dots) at both the transcriptomic and cellular survival phenotypes. *P < 0.01 by two-sided Student’s t test. **P < 0.01 to all other groups. d Effect of individual sgRNAs targeting the KMT core (black; three independent sgRNAs), AF9-binding motif (green; three independent sgRNAs), or R1 center (red; three independent sgRNAs) of DOT1L on the proliferation of MLL-AF9-Cas9+ leukemia. Data represent mean ± 95% confidence interval of a quadruplicate experiment. **P < 0.001 by two-sided Student’s t test compared to a sgRNA targeting Luciferase (sg-Luc; gray). e Western blot of H3K79me2 and total histone H3 in MLL-AF9-Cas9+ cells expressing indicated sgRNAs (three independent sgRNAs per domain). f Annotation of cells harboring sgRNAs targeting the KMT core (red) or R1 element (pink) on UMAP. g Correlation of gene expression changes induced by sgRNAs targeting the KMT core (x-axis) and R1 element (y-axis) summarized from the sc-Tiling of DOT1L. h Overlap of differentially expressed genes in cells harboring sgRNAs targeting the KMT core (orange) and R1 element (green), including the known DOT1L-driven leukemia genes Hoxa7, Hoxa9, and Hoxa10. n.s. Not significant. Source data are available in the Source Data file.

