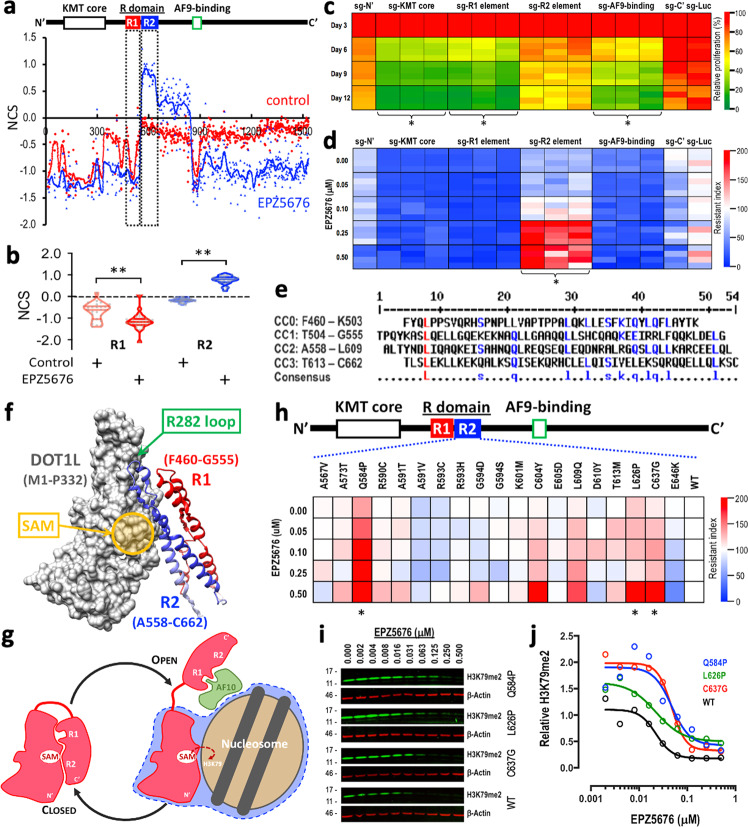
Fig. 3. sc-Tiling identifies noncanonical EPZ5676-resistant alleles in the human population.
a Normalized CRISPR score (NCS) of each sgRNA construct (dots) and the smoothed score (line) of the pooled DOT1L-tiling survival screen before vs. after 12 days of treatment in control (red) or 1 µM EPZ5676-treated (blue) MLL-AF9-Cas9+ leukemia cells. Data represent the average of a triplicate experiment. b Violin dot plots showing the NCS of each sgRNA targeting the R1 (red; 27 sgRNAs) and R2 (blue; 36 sgRNAs) elements in control (DMSO) or 1 µM EPZ5676-treated MLL-AF9-Cas9+ leukemia cells. **P < 0.001 by two-sided Student’s t test. c Heatmap showing the effect of individual sgRNAs targeting the indicated areas of DOT1L (Supplementary Fig. 6) on the proliferation of MLL-AF9-Cas9+ leukemia cells on days 3, 6, 9, and 12. Data represent the observed values of a quadruplicate experiment. *Significantly (P < 0.01 by two-sided Student’s t test) more depletion compared to the sgRNA targeting a non-essential Nʹ region (sg-Nʹ) on day 12. d Heatmap showing EPZ5676 resistance index of MLL-AF9-Cas9+ leukemia cells transduced with sgRNAs targeting the indicated areas of DOT1L (Supplementary Fig. 6). Data represent the observed values of a quadruplicate experiment. *Significantly (P < 0.01 by two-sided Student’s t test) higher resistance compared to sg-Nʹ at 0.5 µM EPZ5676. e Peptide sequence alignment of the R domain (residues F460–C662) in human DOT1L. The predicted alpha-helices in this coiled-coil domain are designated CC0–CC3 and the consensus residues between the helixes are noted. f Computationally modeled structure of the human DOT1L R1 (red) and R2 (blue) coiled-coil domains interacting with the KMT core domain (gray; PDB ID: 3UWP)46. g Cartoon representation of the R1/R2 self-regulatory module mediating the closed (left) vs. open (right) states of DOT1L. h Heatmap showing EPZ5676 resistance index of MLL-AF9 leukemia cells transduced with human DOT1L cDNA harboring clinically observed variants (from cBioPortal database) in the R2 element. Data represent the averaged values of a quadruplicate experiment. *Significantly (P < 0.01 by two-sided Student’s t test) higher resistance compared to wild-type at 0.5 µM EPZ5676. i Western blot images of H3K79me2 (green) and β-actin (red) and (j) quantitative measurement of relative H3K79me2 level (normalized to β-actin) in MLL-AF9 leukemia cells transduced with wild-type (WT; black), Q584P (blue), L626P (green), or C637G (red) human DOT1L cDNA. Cells were treated with EPZ5676 for 3 days. Source data are available in the Source Data file.

