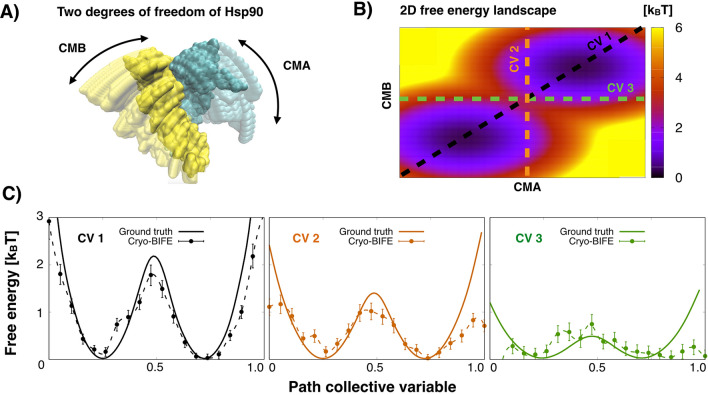
Figure 4.
2D analysis of Hsp90. (A) Two degrees of freedom of Hsp90 along the CMA and CMB rotation directions (see the Methods). (B) Ground truth free-energy surface along CMA and CMB directions. Black (CV1), orange (CV2) and green (CV3) dashed lines show three paths used for the cryo-BIFE analysis. (C) The free-energy profiles along these three path CVs, extracted with cryo-BIFE using synthetic particle images (dashed lines), are compared to the ground truth projected profiles (solid lines). The R-hat test for the MCMC yielded values for all cases. The bars show the credible interval at 5% and 95% of the empirical quantile at each node. The results are for the second BioEM round of orientation estimate.

