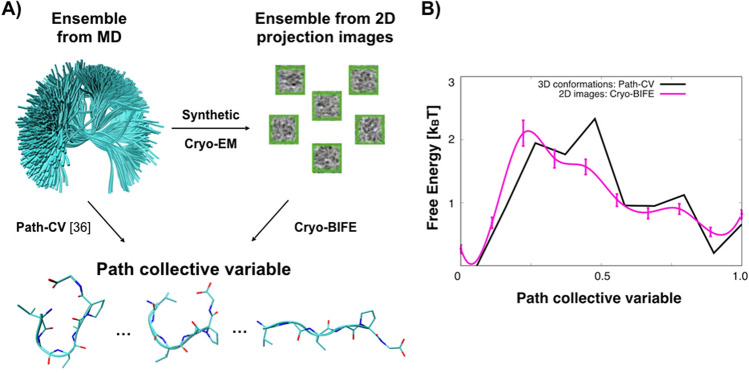
Figure 5.
Free-energy profiles from 2D images (cryo-BIFE) or 3D conformations of the VGVAPG hexapeptide. (A) The conformational ensemble of the VGVAPG hexapeptide from MD simulations is used to generate synthetic images. The nodes belonging to the path (bottom) are selected with equally spaced end-to-end distances between successive nodes (see the Methods). The path-CV36 method compares 3D conformations to the path nodes, whereas cryo-BIFE compares 2D particle images to the same nodes. (B) Free-energy profile calculated over the 3D ensemble using the path-CV with RMSD metric [Eq. (8) in Ref.36] with Å –2 (black), and the expected free energy extracted using cryo-BIFE with synthetic cryo-EM particles (pink line). The R-hat test for the MCMC yielded values for all cases. The bars show the credible interval at 5% and 95% of the empirical quantile at each node. See the Methods for details about the path and set of images for each system.

