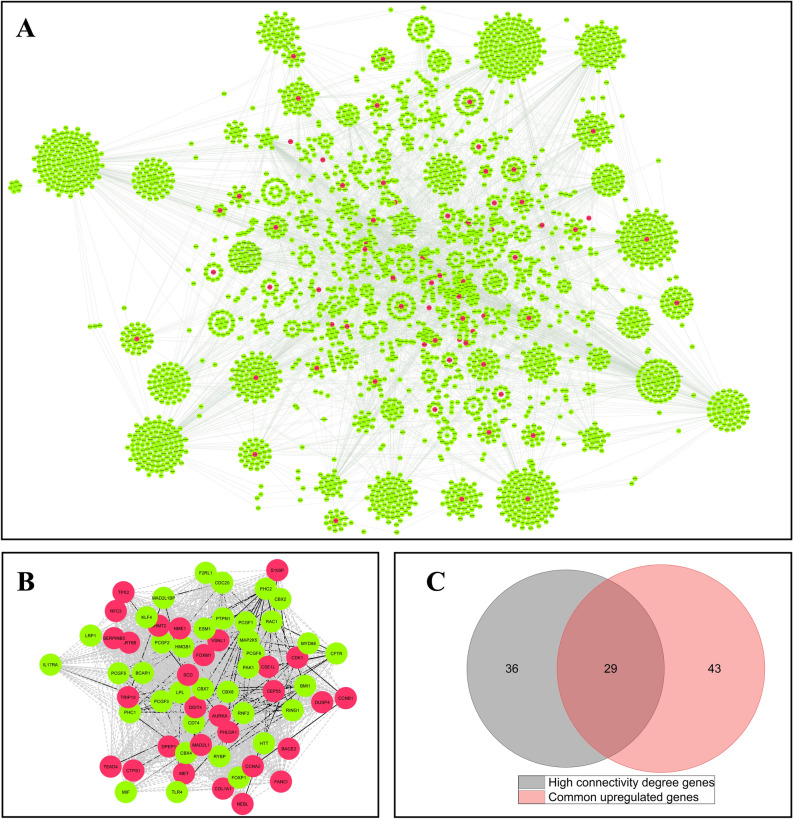
Figure 3.
Protein–protein interaction (PPI) analysis based on IMEX database for common upregulated DEGs and detection of hub genes. (A) The nodes represent genes and edges represent the interactions between genes. The red nodes signify 72 common upregulated DEGs that are in the interaction with each other and other genes (green nodes). (B) PPI network analysis revealed the genes with high connectivity degree (> 75 percentile for the genes with degree > 10) by cyto-Hubba plug-in using Cytoscape software. The dashed lines indicate the connection of genes that are not direct. (C) The genes with high connectivity degree that overlapped with common upregulated DEGs were extracted as hub genes by Venn diagram.

