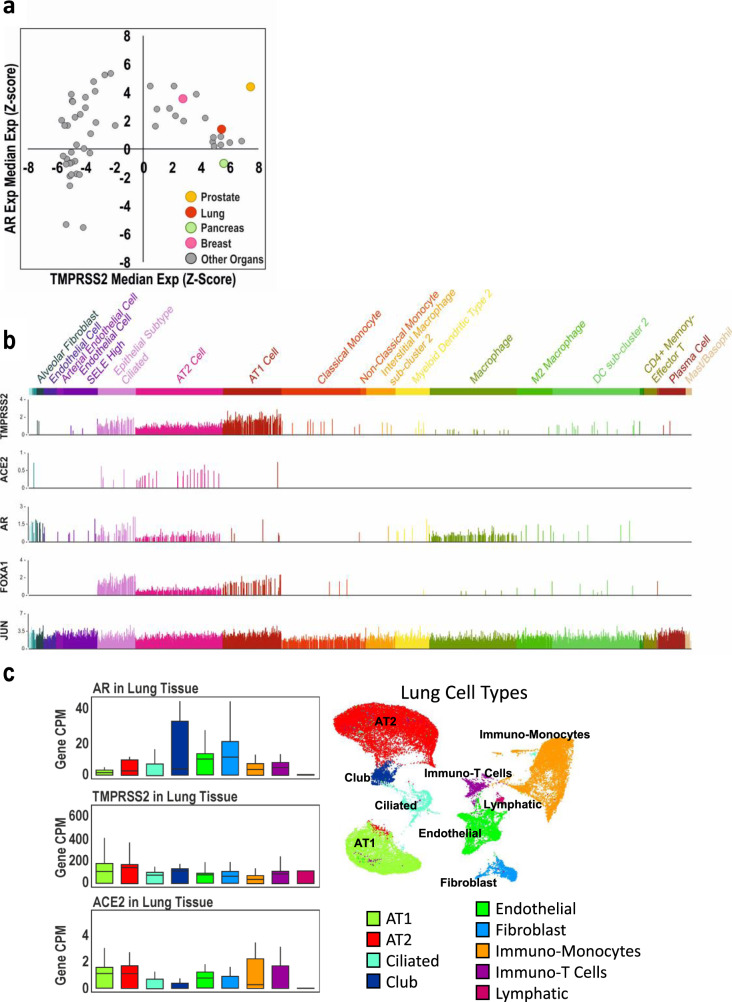
Fig. 2. TMPRSS2 and the AR are expressed in the lung.
a The GTEx dataset40 was interrogated and median expression of AR was plotted against median TMPRSS2 expression. Data are expressed as each gene normalised across all tissues (z-score). Highlighted are prostate (n = 245), lung (n = 578), pancreas (n = 328) and breast (n = 459). b Single-cell analysis of lung tissue41 with each bar representing AR, TMPRSS2, ACE2, FOXA1, JUN expression within individual cells of each specified cell type. c Single-cell analysis of lung tissue42 was interrogated and a breakdown is shown of AR, TMPRSS2 and ACE2 expression levels in specific lung cell types (X-axis); Y-axis denotes gene mRNA CPM.

