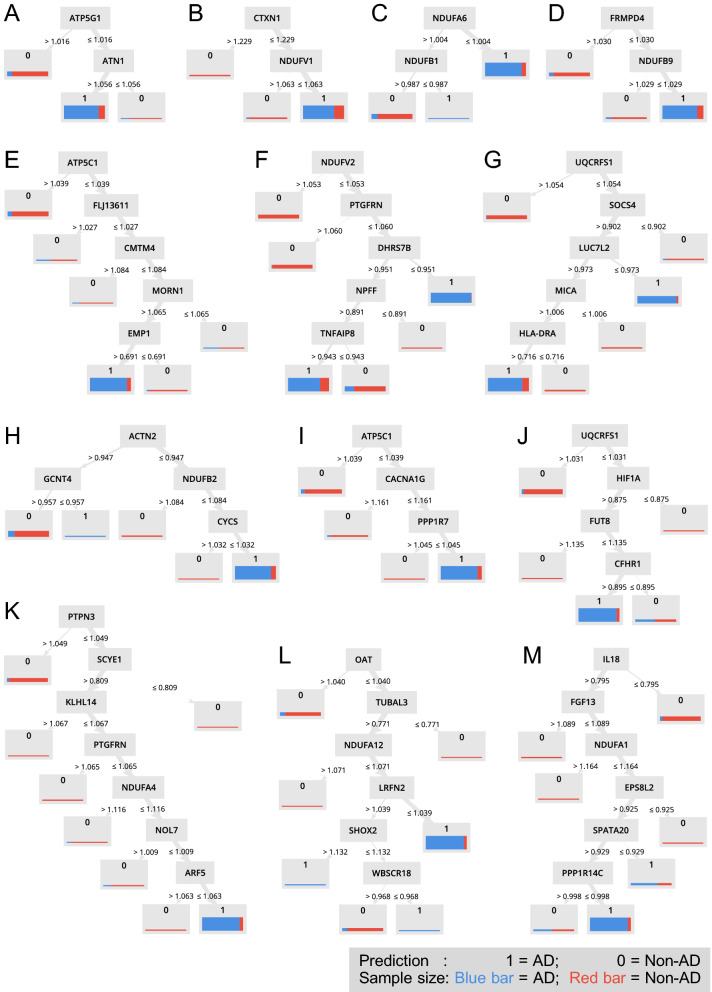
Figure 5.
Slightly down-regulated oxidative phosphorylation genes predict AD. (A) to (M) The decision trees from the random forest model containing NDUFA1, NDUFA4, NDUFA6, NDUFA12, NDUFB1, NDUFB2, NDUFB9, NDUFV1, NDUFV2, UQCRFS1, ATP5F1C, and ATP5MC1. The prediction outcome is denoted by 0 and 1, where 1 = AD, and 0 = Non-AD. The sample size is denoted by the thickness of the bar, while the sample type is denoted by blue or red, where blue bar = AD, and red bar = Non-AD.

