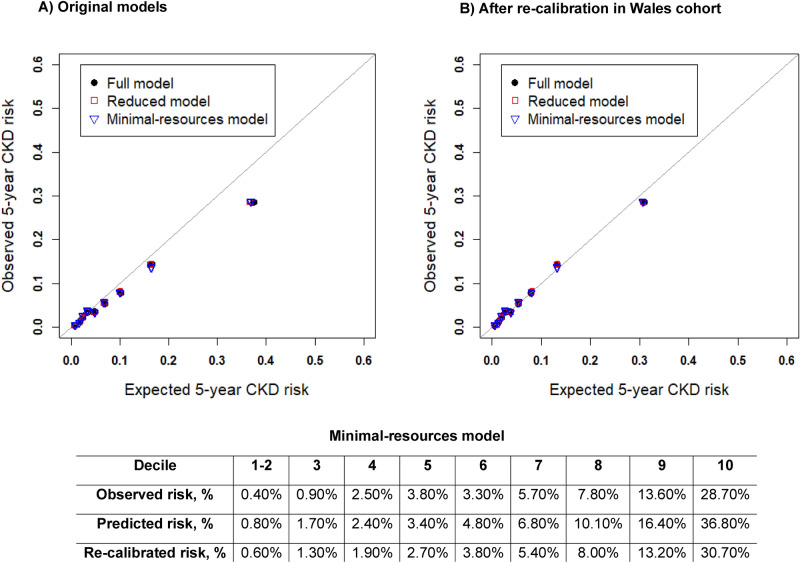
Figure 2.
Calibration plots for derived models. Model predictions against observed event rates at 5-years given for 10 risk groups (collapsing first two groups due to inadequate event numbers in first two groups). Predictions from each decile were averaged, so these plots represent mean predicted risk against observed risks (KM-rates). (A) Represents 5-year calibration, baseline survival estimates from model development given as; 0.9824, 0.9824, 0.9828 at 5-years for the three models respectively, were used to compute risks in this group. (B) Represents 5-year calibration plot- after recalibration, re-calibrated baseline survival estimates given as; 0.9863,0.9860,0.9864 for full, reduced and minimal resources model respectively. Raw risk percentages provided below the plots for the minimal resources model.

