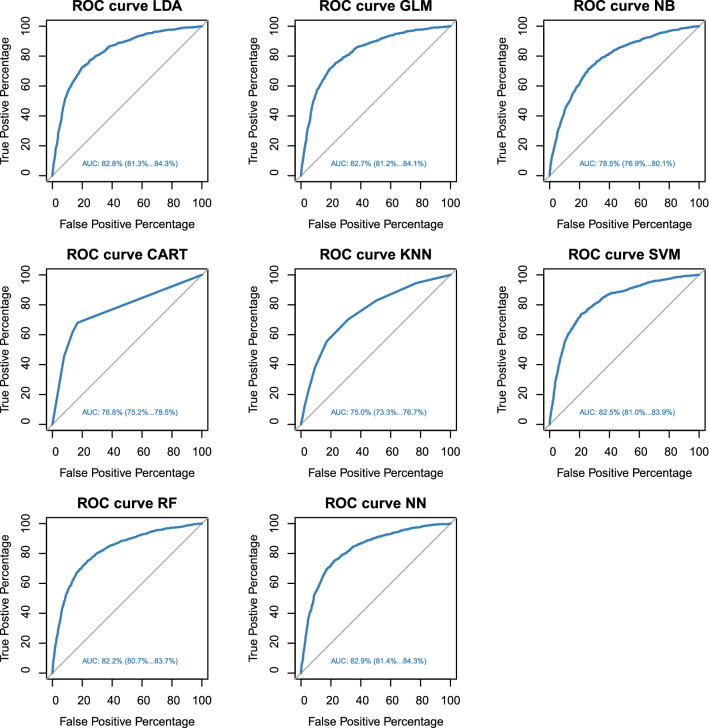
Figure 5.
Comparing Receiver Operating Characteristic (ROC) curves of eight machine learning methods [Linear Discriminant Analysis (LDA), Generalized Linear Model (GLM) with logit link function, Naïve Bayes (NB), Classification and Regression Trees (CART), k-Nearest Neighbors (kNN), Support Vector Machines (SVM), Random Forest (RF) and Neural Network (NN)] run on the validation set, in prediction of udder health status of dairy cows according to somatic cell count below or above 200,000 cells/mL from cow’s and milk data recorded at the previous test-day record. In each plot, area under the curve (AUC) and 95% confidence interval were reported.

