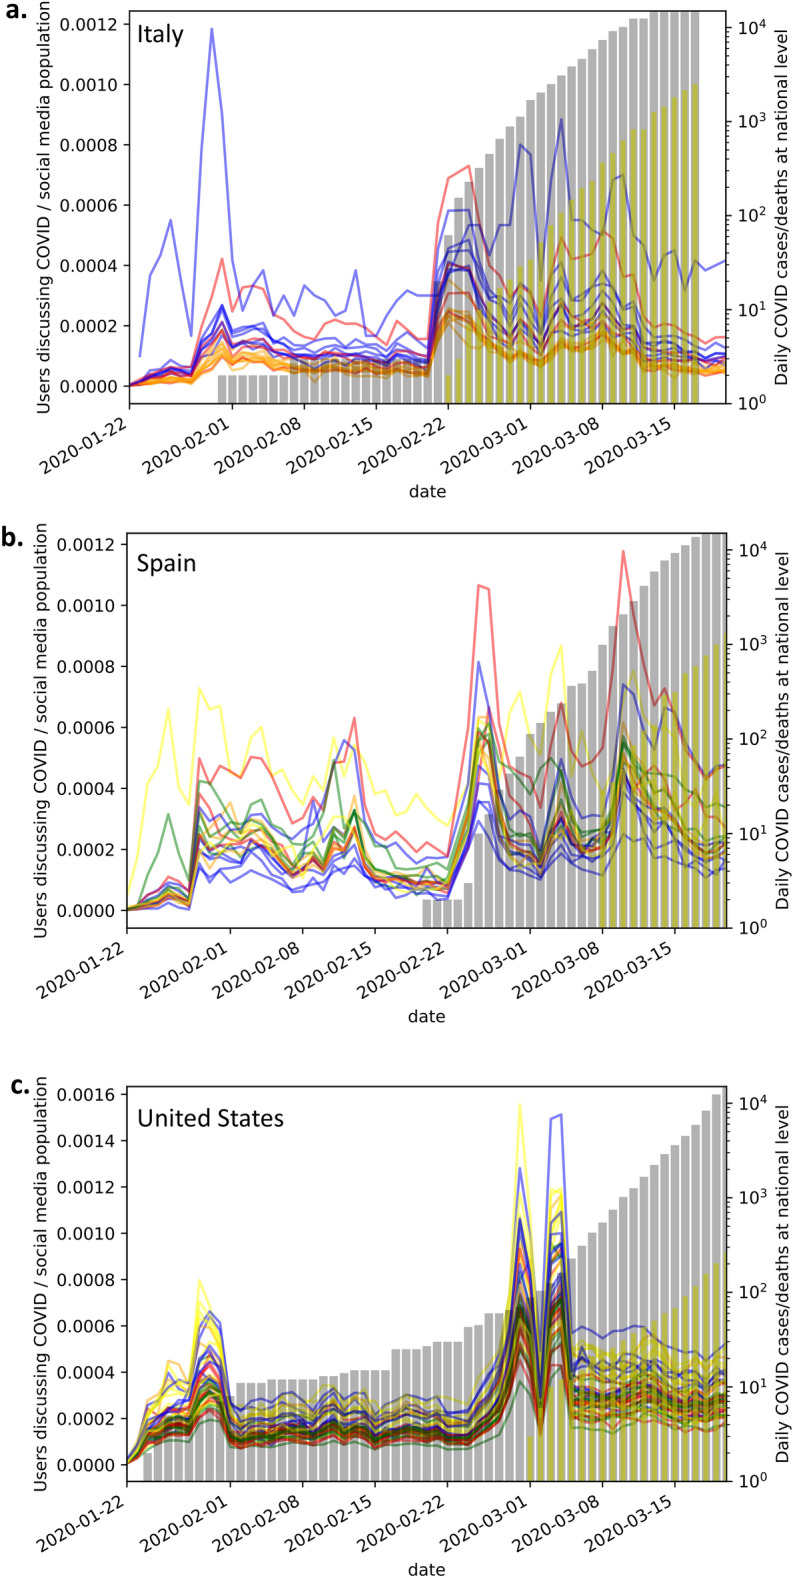
Figure 1.

Plots of COVID-19 related Twitter activity superimposed to number of confirmed COVID-19 cases and cumulative number of deaths nationwide. Twitters are geolocated and aggregated by geopolitical regions for (a) Italy; (b) Spain and (c) United States. For each country we group and color code regions by geolocation in the following way: (a) Italy: Northern regions (blue), Central regions (red) and Southern regions (orange), (b) Spain: Northeastern regions (blue), Northwestern regions (green), Central regions (red), Southern regions (orange), Autonomous cities (yellow), (c) United States: Northeastern states (blue), Southeastern states (green), Midwestern states (red), Southwestern states (orange), Western states (yellow). The growth of confirmed COVID-19 cases nationwide (cumulative) is represented by grey bars while the cumulative number of COVID-19 deaths nationwide is represented by yellow bars.
