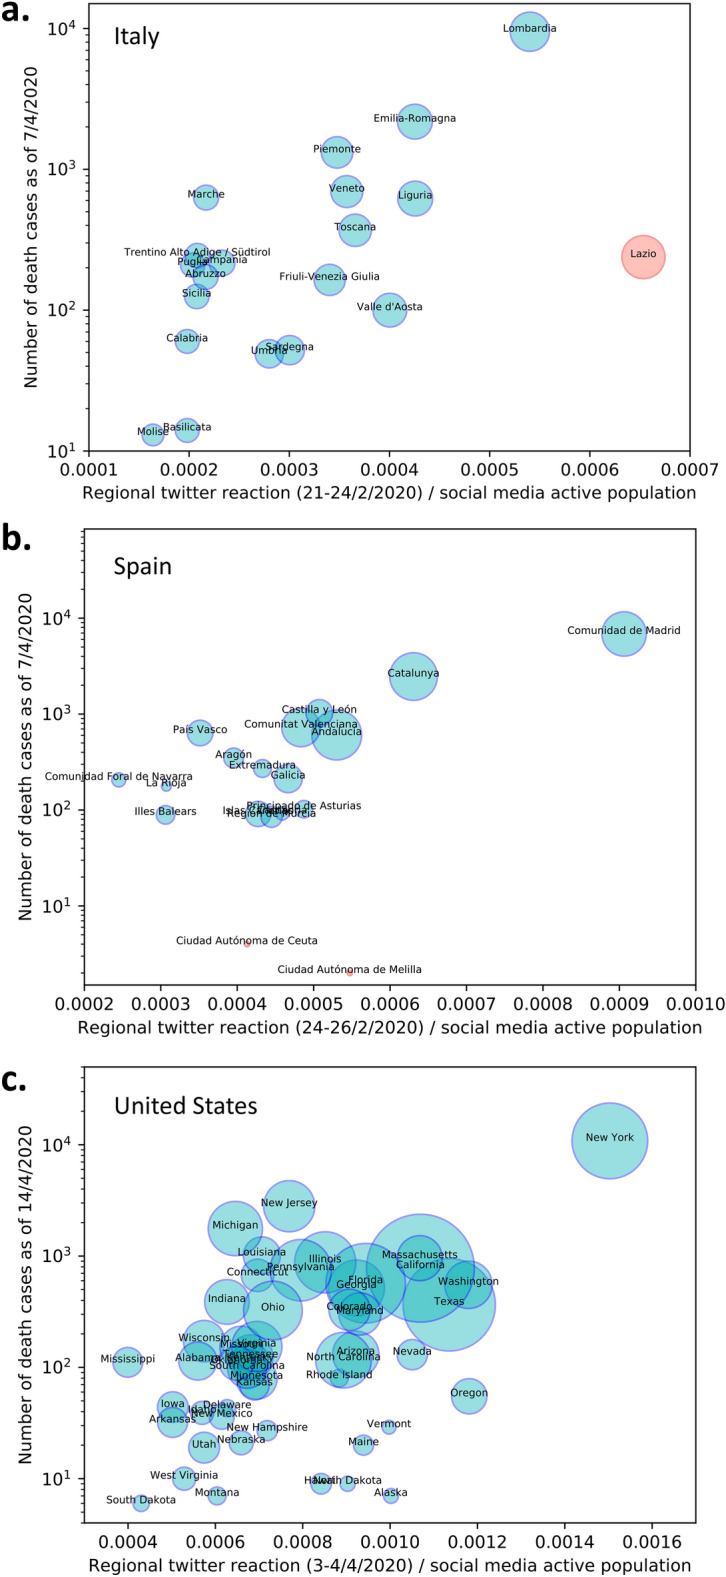
Figure 3.

Demonstration that the reaction on social media can correctly detect and rank the epidemic’s impact on different regions one month ahead. The y-axis reports the cumulative number of deaths one month forward and the x-axis reports mean tweet intensity at the initial attention peak per geopolitical region of: (a) Italy; (b) Spain and (c) United States. The diameters of the circles are proportional to the population of the region.
