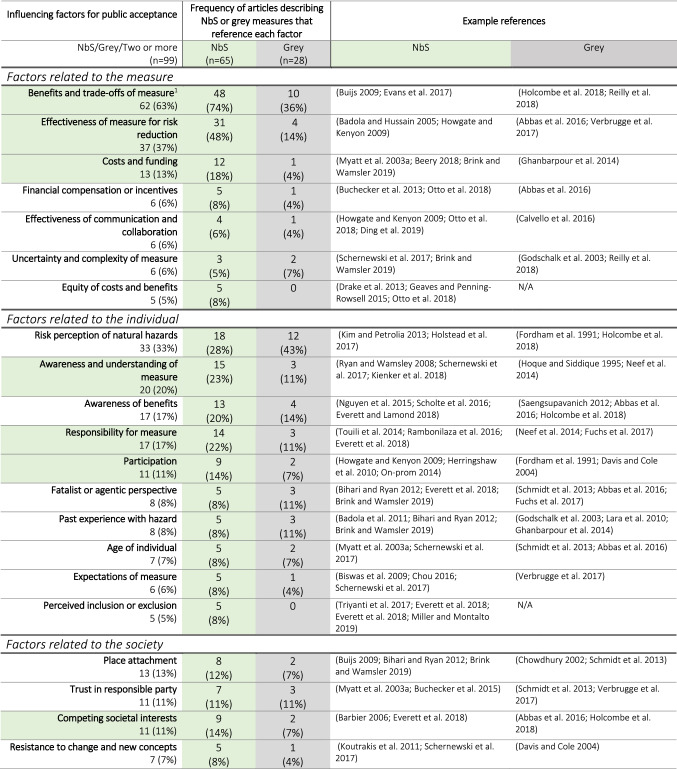
Table 3.
Influencing factors for public acceptance grouped by relation to the measure, the individual, or the society. Within these groupings, the factors are listed from highest frequency to lowest frequency considering all the articles (n = 99; including articles describing NbS [n = 65], grey measures [n = 28], and two or more measures [n = 6]). The second column (green) shows the number and percentage of NbS articles (out of the 65 total) that reference each factor in relation to public acceptance. The third column (grey) replicates this for articles describing grey measures. A factor’s row is highlighted in green if the factor (a) occurs in n ≥ 10 total articles and (b) the percentage of NbS articles that reference it is at least double the percentage of grey articles that reference it. An example is provided in the footnote of the table
1Benefits and trade-offs of measure’ is referenced in 63% (n = 62) of all 99 articles. It is referenced in 74% (n = 48) of the 65 NbS articles and 36% (n = 10) of the 28 grey articles. The remaining four articles of the 62 total in which it is referenced describe two or more measures. It is highlighted in green because a) the total mentions is greater than 10 (62 > 10) and b) the percentage of NbS articles is at least double the percentage of grey articles that reference this factor (74 ≥ 36*2)

